Designing Visual Language provides a full and detailed breakdown of a data display. In a sense, the article includes the who, what, where, why and how of a data display. The key to data displays, said in the introduction, is that “they greatly enhance our ability to compare numbers.” Bottom line, the purpose of a data display is to provide information through a visually pleasing yet informative way.
Ed Loeffler, member of a large nonprofit organization, goes through the detailed process of creating a data display in chapter 7. Ed begins by compiling the information on the organization’s membership over the past 10 years and fitting it into a table defined by age and year. Realizing that a table is not the most effective way to display his data he considers:
- audience
- purpose
- context
This leads Ed to format the data into pie charts, visually pleasing yet still not effective in displaying the data properly. Ed eventually lands on a multiple bar graph because it allows him to display the data in one chart and “his readers will appreciate the conciseness.” Ed later realizes that this format isn’t the easiest for comparing the data so he turns the bars horizontally. The chart still seems cluttered and Ed decides this still isn’t the most effective way to display his data so he moves onto a line graph. The graph represents his data in a clear, visually pleasing and concise way. The final step is to edit the graph itself by adjusting the lines, enhancing the clarity, placing labels and adding a title. Creating a data display can be a long and tedious process as shown by Ed.
This chapter also provides the vocabulary list for data displays:
- textual elements (describes the data)
- spatial elements
- pie charts
- bar charts
- line graphs
- scatter plots
- data maps
- gantt charts
- graphical matrix
- graphic elements (make the data visible to readers, brings the display to life, giving it form and substance)
- synergy of the coding modes (provides a rich vocabulary with which to display information)
Laying out the main elements of a data display breaks the process down into something simpler. Choosing the correct elements is the complicated part but the chapter goes on to explain the most efficient way to do that as well but that is not the part that struck me. The introduction to this chapter held some very key words.
The three reasons that data displays are useful rhetorical tools:
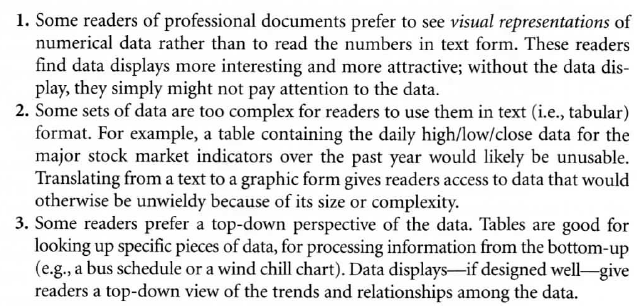
When reading through this, number 1 immediately struck me as describing myself. I’m not your typical reader of professional documents but when reading any document I would rather the numbers by displayed in a numerical form in a chart than read the numbers in text form. I thought of problems that I have been given in math classes over the years. The questions that always gave me trouble were the word problems. When the numbers are lined up in a simple problem format the problem is much clearer and easier to solve but add the complexity of words to the numbers and the problem immediately becomes difficult. It takes more time to decipher what the question is actually asking, to extract the numbers the numbers from the problem and then to actually solve the problem. Data displays and math problems are similar in the way that adding words to the numbers makes the actual data harder to understand and convoluted, not to mention it isn’t as visually pleasing as a data display.