
Chapter seven of the textbook Designing Visual Language discusses the impact of data displays on a readers’ ability to conceptualize information. When I first read the term “data display” I immediately pictured a table or graph full of complex numbers and information that would probably take a good amount of time to interpret. A couple paragraphs into the chapter I quickly realized that the purpose of data displays are quite the opposite of what I initially thought.

Data displays “show quantitative information by transforming textual elements–usually numbers—into images” (245). Although they sometimes contain text, its purpose is only to clarify the nontexual elements in the display (for example: axes titles, axes labels or legends). The main function of a data display is to enhance the readers’ ability to compare numbers in an easy and understandable way using graphical elements (for example: grid lines pot frames, tick marks, background shading) They are more than useful in representing complex numerical data that may be too difficult to grasp in text form, but also in giving a “top-down” perspective of data that can lead to individuals noticing trends a lot faster than they would otherwise.
“Technology now provides a wide array of tools to design not only static displays but interactive ones as well”( 246)
In designing a data display chapter seven also talks about six strategies that can be used to apply rich visual vocabulary to data displays: arrangement, emphasis, clarity, conciseness, tone, and ethos. Arrangement strategies are used to choose appropriate display types for the data and decide how the data is grouped is these displays. Emphasis strategies are used to highlight the main points that you are trying to make with your data display. Clarity strategies largely depend on how well the display adheres to the perceptual principles of benchmarks, area, gray scales, and perspective. Conciseness strategies help the creator of the display recognize the spatial conciseness in terms of “data density” and graphic conciseness in terms of “data-ink.” Tone strategies help form the mood of the display; is it serious, friendly, or formal? Lastly ethos strategies help make sure the display accurately tells the readers the story about the data without
manipulating the facts.
The message I got from this reading really changed the way I had previously viewed data displays. By combining the above strategies, creators of these images can effectively clarify data that they want readers to understand. Because they allow for complex rhetoric to be emphasized in an image instead of text, data displays are a unique way to make a point.
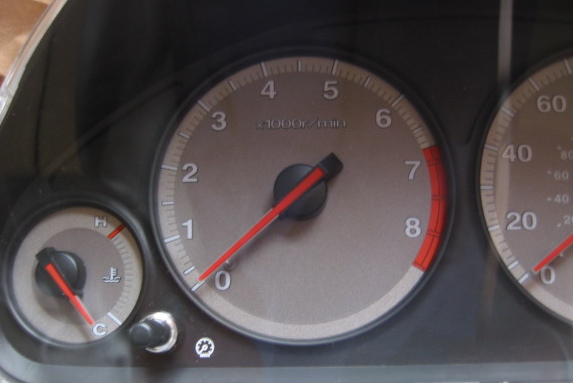
A common spedometer
When I looked further into data displays I came upon an interesting blog post written by Robert Kosara on July 5, 2012. He gave a great example of how a data display can make information easier or more difficult to comprehend by comparing reading how fast you are going when your driving. Because the little red arrow points to your speed and constantly changes when you accelerate or decelerate, it is easy for most people to recognize how fast they are going while also paying attention to the situation on the road. Kosara comments about how some spedometers are more complicated saying, “some cars have direct numerical displays for speed, and those are much harder to read. In fact, all cars I’ve seen so far with such a display also have some kind of bar display in addition that also shows the speed (though with much less precision).” In this same way, data display can be either helpful by clarifying data, or hurtful in making it more complex.
2 Responses to A Picture Worth 1000 Words: Significance of Data Displays