
By Lisa Kelley and Chris Bacon*
This post builds on last week’s discussion of survey design and implementation, as we focus on the steps we have taken since to ensure that any survey analyses we perform will be robust, transparent and reproducible by others.
Original survey data rarely arrives perfectly “clean.” This is true even when using new survey 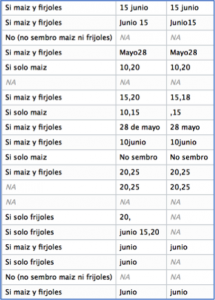 collection platforms that circumvent the need to manually enter paper-based survey responses. In this case, we used a platform called Qualtrics (there are other software packages, such as Kobo Toolbox, that are open source), which directly transforms recorded survey responses recorded into .csv, .xml, .spss or .tsv format. Even with the use of Qualtrics, however, this year’s household survey data was not always immediately suitable for exploration and analysis. For example, examine the data columns to the left. The column to the far left notes whether or not area is held in basic grains, and the second two columns record the date of 2015’s first corn and/or bean planting. To make these more easily analyzable, we have to first standardize existing dates and determine how we will treat data entries missing a month or day value.
A full data cleaning and wrangling process can include efforts to standardize entries (e.g. correcting mis-spellings), remove or correct obviously errant values (e.g. -2 household members), impute missing values relying on context-specific expertise or available survey data, compute derivative values (e.g. a value for total area land holdings by summing across all reported household land holdings), or manipulate the shape of the data table to facilitate analysis.
The ideal in this process is perfect reproducibility of the data maintaining a raw file of the data exactly as it was recorded (i.e. through survey collection) and performing all cleaning operations through programming scripts that modify and reproduce the database while leaving the raw data untouched. This can quickly become an enormous task. As Hadley Wickham says, summoning Tolstoy on unhappy families: “Tidy datasets are all alike, but every messy dataset is messy in its own way” (from R for Data Science: p. 147).
Below is a description of how we have approached data cleaning and wrangling with household surveys through this project to ensure the accessibility and reproducibility of later analyses.
- Developing a work flow that meets the data needs of all project partners: The different researchers on our team have comfort with different platforms for data exploration and analysis. For this reason, we needed an approach that produced interpretable and clean data in multiple formats (in our case, R, Stata and Qualtrics, our original survey capture software). To facilitate this, we adopted this approach:
- Examine the original raw data file in Qualtrics (or other software program that you are using), remove any practice surveys or duplicates, and download the raw data (thereafter to be untouched). Keep detailed notes on any surveys removed.
- Anonymize the data by removing the names of interviewees and replacing them with a coded household ID.
- Create a code book with all questions and bief – yet descriptive – variable names.
- Perform all data cleaning through well-commented computer scripts in either R or Stata (in R, the packages “stringdist” and “tidyverse” have been especially helpful).
- Utilize the “sjlabelled” package in R to allow for conversion between R and Stata; this makes it relatively to move data back and forth between either analytical platforms.
- Re-upload the cleaned database into Qualtrics in a NEW survey database such that other team researchers can use the Qualtrics platform with built-in data analytics without further modification of the underlying data.
- Cleaning for functionality, not perfection. To manage the time and effort associated with data cleaning we adopted the philosophy: clean for functionality, not perfection. Some data columns either have too few entries to be meaningful or don’t appear analytically interesting or important. For now, and unless they become analytically meaningful for some reason, we won’t clean these columns.
- Thoroughly documenting all changes made to the code or the underlying data in both coding comments and writing. This practice is helpful even for the person writing the code and performing the data cleaning. It addition to including scripted comments that allow non-coders to understand the work flow embedded within the scripts, comments can document the specific rationale for various analytical decisions (i.e. data values to impute, how missing vs. skipped values are coded). Preserving a text version describing this process is also important for sharing data inside and outside the project team.
- Append new columns when/if data values are imputed. With regards to the above data columns on corn and bean plantings, for example, we might clean the original data column to only include values that contain both a stated month and date with all other entries marked as NA. However, we could also impute data by relying on context-specific expertise. For example, if data entries only contain a day value, we could impute that earlier day values ranges (i.e. 10-15) refer to the June month and later day values (i.e. 15-30) refer to the May months. Similarly, if data entries only contain a month value, we could impute the day value from the mean across all complete observations for the reference month. If the variable is important, adding the imputed data as a new column allows us to compare the raw cleaned data and the imputed data to assess whether they tell meaningfully different stories.
- Append columns that contain data quality flags. When imputing values as above, it is also helpful to create an additional column that contains a quality flag (i.e. an observation has a value of 1 if the original contains both a month and date; a 2 if the original column contained just a date; and a 3 if the original column contained just a month). This practice is particularly important in datasets with a large number of observations; it might be overkill in small n datasets.
- Using checkpoint (or similar) to ensure that the scripts will be reproducible in future years. Check out the perils of not doing so!
- Version control as working particularly when large collaborative team and thorough documentation of changes made to code or underlying data. Some people use naming conventions and Google Drive or Dropbox, some have use more sophisticated programs such as those developed by git hub.
- Grappling with larger issues as a team and with people with context-specific expertise. First it is important to know your data and the context. If you maintain contact with the field research team, as we do in these long-term participatory processes some data can be cross checked and validated or omitted. We generally do very little or no data imputation, but in can be done under specific circumstances with detailed notes and justifications. There are also many questions about the data management (we refer to our data management plans in larger projects, and questions, such as, how much anonymizing to do — do we remove community names and individual ages when preparing data to upload for potentially publicly available databases (e.g., ICPSR), but leave the municipality and district names? The good news is that places like ICPSR and Harvard Dataverse have detailed suggestions about how best to manager this data.
We have two concluding remarks. First, remember to take detailed notes that document all changes made to the original data (this is embedded in the code if you are using R or STATA, but if you are still using a spreadsheet metadata notes are essential to ensure reproducibility). Finally, we return to the interactive and iterative participatory process with community-partners and the importance of sharing results and anonymous data with those that can use findings to take next steps towards achieving their self defined goals.
*Most of what we have learned in how to do this is from our collaborator Bill Sundstrom.