How to Choose the Right Data Visualization Types

At a glance, data visualization is about drawing a picture with your data rather than providing numbers and facts. Going by this definition, anything put forth to represent the data counts. But not every way of representation is apt for every situation. Different situations(depending on the data and audience) call for specific ways of representing data. With that in mind, I am listing out five different ways of data representation and their optimal usage. 

1) Bar Graphs 

Bar graphs could be horizontal, vertical or stacked. While horizontal graphs are used mainly for comparative ranking, vertical graphs(column) are used for showing chronological data. Stacked charts are a bit more complicated in that they usually show the part to whole relationship. The problem for bar graphs, in general, is that it gets cluttered if there is a huge amount of data to be represented. Moreover, labeling would be difficult with a cluttered graph.

2) Maps

Maps form one of the most complete ways of representing data when various geographical areas have to be compared/contrasted. Maps can do more than just displaying data. They can direct action as well. Despite all this, maps have their disadvantages as well. Simply put, if the data that needs to be visualized does not involve a geographical area, it doesn’t need a map. Moreover, as with bar graphs, too much data can clutter the map and filling the map with data points doesn’t make for a pleasant viewing, not to mention inundating the viewer.

3)  Line charts  

Trends. Dynamism. Volatility. Line charts portray these aspects with an unerring efficiency. They display relationships in how data changes over a period of time. A cursory glance at the line chart given below lets the viewer know that the amount of sales by means of credit cards were the highest(this is just a minute part of what the whole chart says).

As with most other ways of representations, line charts become confusing if the number of variables to be represented shoot up. Besides, a legend is imperative to decipher the meaning of the chart and the viewer may be forced to constantly refer to the same for interpretation.

4) Area charts

Like its close relative, area charts too are most effective when used to represent time series relationships and for facilitating trend analyses. Area charts are of two types, unstacked(which is basically a line chart with enclosed colored areas) and stacked area charts. Stacked area charts and more informative and consequently, is used more. They portray a part to the whole relationship.

As long as one sticks to stacked charts for representing a part to the whole relationship of not more than 6-7 values, an area chart seems to be a perfect choice. Unstacked charts clutter quickly and can be used only for 3 or fewer values.  

5)  Scatter plots

If correlation in a large data set is what one needs out of a representation, scatter plots are the way to go. The data set needs to be in pairs with a dependent and an independent variable. Upon distribution of data, the result would show a positive/negative/neutral correlation. The addition of a trend line would make it more informative by highlighting the correlation and shows how statistically significant it is.

Contrary to most other forms of data representation, scatter plots need a large amount of data to appear meaningful. A scatter plot with only a few variables would appear empty, with little to no information provided for the viewer.


Source : http://www.datapine.com/blog/how-to-choose-the-right-data-visualization-types/
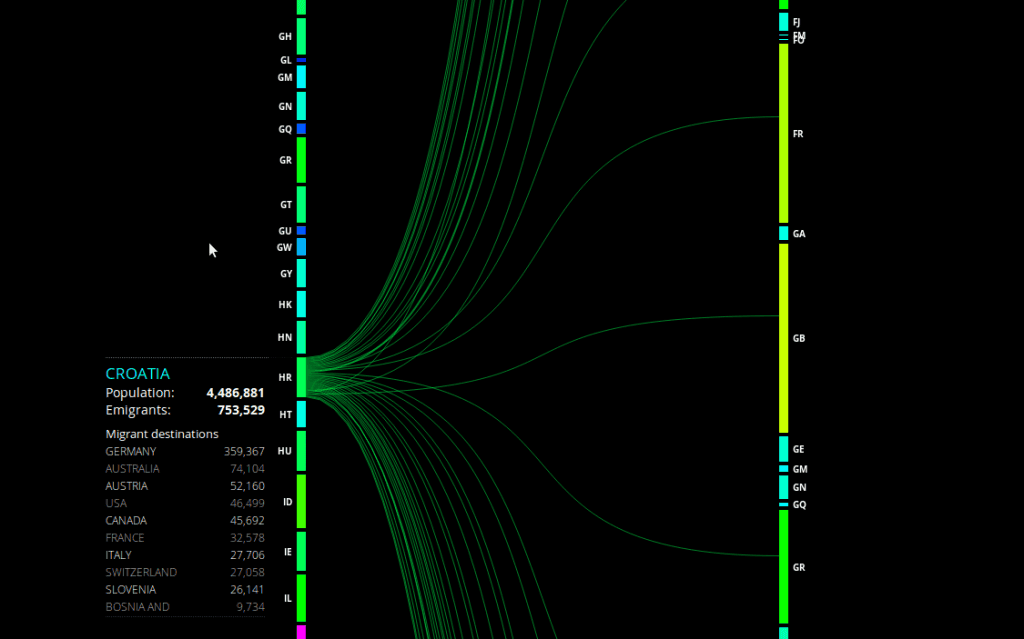
Is interactive visualisation always a good option?

Peoplemovin is an experimental data visualization project which shows the immigration status of people from around the world. Created by Carlo Zapponi, this interactive visualisation shows flow of 215,738,321 migrants as of 2010. The data has been collected from the World Bank and plotted as flow charts representing the flow from emigrant country to the destination country. The blocks on the left represent emigrant country and the blocks on the right are the destination countries. Carlo has used attractive colour schemes with a different colour from blue to red to compare a particular country with the rest of the world. For example, the immigration details of India show that the largest number of Indians have migrated to the United States. The thickness of lines is used to represent the volume of immigrants. But it is difficult to get the exact figures by just looking at these lines. For this reason, the detailed figures for each country’s immigrants can be seen in a table on the left, based on the country selected by the user. Though, the visualisation is very attractive and informative, listing all the countries on the same page makes the columns on both sides very long, making it a little difficult to see the connecting flow lines. In my opinion, the visualization could have been simpler and more information.

Reference: https://datavisualization.ch/showcases/peoplemovin-visualizes-migration-flows/

Designing a effective KPI Dashboards

A good dashboard makes us think directly about metrics rather than aesthetics itself. Therefore, it should be designed to facilitate ease of use. Since the best dashboard designs work on the subconscious level, it can be hard to pinpoint exactly what makes them so effective. But if we look beyond specific techniques for creating a dashboard, we’ll see three common themes.

  1. IT’S FUNCTIONAL.

A well-designed dashboard must first and foremost be functional. A dashboard is “a visual display of the most important information needed to achieve one or more objectives, consolidated and arranged on a single screen so the information can be monitored at a glance.”

Since the primary purpose of the dashboards is to clearly communicate our most important metric, it’s only logical for the design to enhance this functionality. Any design elements that hinder the objective should be discarded.

  1. IT’S INTUITIVE.

As mentioned earlier, dashboards should be glanceable. In order for a dashboard to be understandable at a glance, it must be intuitive. This involves two aspects: 1) removing cognitive barriers (such as misleading pie charts, 3-D visualizations and unnecessary information) and 2) properly visualizing and labeling the metrics.

  1. IT’S LIVE.

An effective, well-designed dashboard is always-on and refreshes automatically (i.e. the data doesn’t have to be manually updated). It’s easy to take this one for granted, but without live updates on the dashboard, your metrics might as well be buried in an email attachment or spreadsheet.

These common themes of KPI’s are a measurement of the result that is a consequence of a goal. As we discussed in the class call for action can also be influenced by the goal. Having this in mind and designing a dashboard with themed framework discussed above will make for a effective dashboards.


Source: https://www.geckoboard.com/blog/dashboard-design-what-makes-an-effective-kpi-dashboard/#.WKqIghIrLdc

Process of making Dashboards – Design Thinking

Picture – https://i2.wp.com/www.tableaufit.com/wp-content/uploads/2016/05/Design-Thinking.png?resize=700%2C332

There are 4 phases of designing a dashboard: What is? What if? What wows? What works?

What is? – This is the part that no one likes. It involves understanding the data, involves a ton of sticky notes and sadly, a 101 crash course on doing the work. People tend to skip this part.

What if? – This is the part which most people want to do first, without understanding the data. We simply throw ideas out here, just like spaghetti at a wall. If it doesn’t stick, it will, at a later stage. Many ideas come and we have to filter out some of the outlandish ones.

What wows? – This is the moment when you feel you have conquered the world and you’re at cloud 9. We begin to realize what Tableau can do. The goal here is prototyping.

What works? – This is the final product. Usually, by this point, we have clarity and have a rock solid dashboard.

Reference : http://www.tableaufit.com/humans-dashboards-tableau-design-meets-ideo-aka-design-thinking/

WHO SKILLED THE INFOGRAPHIC

For today’s blog, I want to share an interesting blog I read from last week: WHO SKILLED THE INFOGRAPHIC

“Infographic posting generally rose steadily from 2007 to 2012, where it peaked, and has begun to decline since then,” Sarah Rapp, the principle visualization designer of Adobe wrote in an e-mail.

Publications are under constant pressure of catching eyeballs since public attention is the most scarce resources in this world. Those most talented visualization designers are working on producing simpler and easy-reading content rather those which were popular once with rich and complex interactive that have a smaller readership.

So what worth we rethink is that what kind of infographic do we really need?

The answer is focused on Insight.

The very medium of data-rich infographics might not be the right thing to the general consumers. For example, sometimes, what a general consumer concern is not how the weather radar looks like today, what you need to do is tell him/her whether he should bring um umbrella or not. So, a simple text-based push sometimes is enough for a mobile-first world.

That gets us thinking when we are doing our project or real task work, we don’t need to pursue a fancy or eyeball catching effect, instead, we should spend more time deciding what key message we want to deliver.


屏幕快照 2017-02-19 21.58.02

( the Lens of 9/11 by Local Projects breathtaking figures but not useful all the time)

reference: https://www.fastcodesign.com/3045291/what-killed-the-infographic

How to D3JS a Line Graph

Steps to D3JS a line graph:

  1. Scale Functions: To make a scale function, you have to know the maximum and minimum data (domain) and output(range).
    • Use this to Position in following manner:

var width = 500;

var xScale = d3.scale.linear().domain([0, 100]).range([0, width]);

  • Use it for Reversing the Y-axis:

var height = 400;

var yScale = d3.scale.linear().domain([0, 10]).range([height, 0]);

  1. Selection Functions: select() selects the first matching element whilst the d3.selectAll() is ‘greedy’ in that it’ll select everything that matches. Once we’ve made a selection we can manipulate the elements using functions such as

style()- Add/modify CSS style declaration

attr() –  Add/modify element attributes;

  1. Data Joins: In our example, we are plotting a line graph. Plotting in line graph is different from others that we learnt in class because data is continuous unlike other discrete idioms that we learnt in class. To make it continuous use ‘Data Joins’.

In our example, We are appending the path to our group for each data point. Then, datum() joins a single entity to a  selection. Attr(“fill”) should be none as it is a line graph and no fill is required Attr(“stroke”) will be the color of the stroke and you can set the width by attr(“stroke-width”).

Reference: https://bl.ocks.org/mbostock/3883245

Yahoo Finance Stock Market Dashboard

Financial Data consists of a time series of price and volume values for a wide array of assets. Financial information can be characterized by the following attributes: large amount, multi-dimensional and abstract nature, complex information structure, hidden information. Making it always perplexing and difficult to understand. Visualizing financial data becomes an arduous task. Some of the important Financial indicators are –

  • Moving Average Convergence / Divergence (MACD),
  • Relative Strength Index (RSI),
  • Simple Moving Average (SMA),
  • Exponential Moving Average (EMA),
  • Rate of Change (ROC)

Yahoo Finance Stock Market Dashboard shows all the above-mentioned indicators and also other possible indicators on its dashboard which makes it complete. It gives you various option to compare different dimensions. It gives you all the important indicators including the Dow Jones Index, S&P 500, Nasdaq and all assets like Silver and Gold rates are updated dynamically. We can select between different time frames for the comparisons and can compare between different stocks. The best part is the Trending tickers in a pallet which shows the important elements like the highest gainer stock, the least gainer, the most active and so on.

The important aspect of Yahoo Finance Stock Market Dashboard is its completeness. And the interactiveness it gives the user to use the dashboard by personalizing it by showing the favorite stocks and the last visited stock.

Ref:  Yahoo Finance Stock Dashboard

Internet of Things

I just found this awesome interactive data visualization from here.

As you can see, this can be seen as a PPT slide, or a dashboard, or a web page for displaying the concept of IoT(Internet of Things), how IoT is used on different sides of real life, and main companies involved in IoT’s development.

With computers being made into wearable devices, and big data analysis and internet connection becoming more and more convenient, now it’s time for us to build some magic. We won’t need to use a remote to change TV channel or go back home to heat the dinner, the IoT would complete these for us. It can even open the curtains and wake us up in the morning. To achieving these, we need to integrate the things we want to connect with different kinds of sensors, mini-computers, wires and so on.

Let’s go back to the visualization, we can see that it includes a timeline of IoT, a divergent line chart displaying various ways of IoT(with one click it can furtherly display the specific IoTs), the detailed IoT devices, explicit IoT data, the flow process of IoT, and the companies building IoT(one bad thing about this is that  a lot of company names are not showing on the chart, but we can go to their website by clicking on the circle). Also the whole visualization has a uniform set of colors, making people comfortable to read it and take in the information it conveys. I think this is a good example of data visualization and hope to adapt to it in my future works.


Difference between info-graphics and visualization

A part of data analytics is to identify and distinguish a visualization and an info-graphic. They both are pictorial or visual representations of data; however, it is essential to use the right kind of representation based on the type, amount, context and relevance.
A data visualization is usually a representation of data as it is- without much editing and processing, usually representing the data as it is. They are mostly automated visualizations generated through algorithms or programmed codes. We can basically say that a data visualization is bound to tell you about the same data in a different way. It does not try to tell any story by itself.
Info-graphics on the other hand can be elaborate diagrams that tell you something using a lot of illustrations, graphics, pictures and icons. An info-graphic can be modeled, modified and designed to make the user look at it in a way or convey a particular message. Info-graphics can be creative and illustrious and omit some data to make the visualization fit the story line.
Again, all visualizations can be considered as info-graphics but the opposite is not true.

References:http://www.jackhagley.com/What-s-the-difference-between-an-Infographic-and-a-Data-Visualisation

Best Dog in Show

This infographic depicts information about the different types of dogs available and aims to categorize the different dogs and predict the best dogs. The visualization is projected in an x-y axis and divides the dogs into 4 different regions: Rightly ignored, inexplicably overrated, Hot Dog, Overlooked treasure.

Things I liked:

  • The graph is aesthetically pleasing as images of the actual dogs used which helps us relate. Also, the use of transparency is excellent.
  • The classification of dogs based on size by portraying actual size difference and the use of color to identify the dog type helps us easily identify each dog.
  • All these provides us with excellent options if we want to buy one, which in this case is the category ‘Hot Dog’.

Room for improvement:

  • Ailment should be deducted instead of being added in the score calculator.
  • No indicator is provided of the amount of exercise or attention required for each dog.
  • This infographic could be made an interactive one with the details like name and all elements of data score being shown when hovered over each dog symbol. Here viewers cannot view the value of the parameters on which data score is calculated.

Lastly, I would mention that each dog is suited for a specific surrounding and perform unique functions so comparing them on the same platform would be unfair.

Reference: http://infobeautiful4.s3.amazonaws.com/2014/11/RETINA_Best-in_show.png