Choropleths or Cartograms?

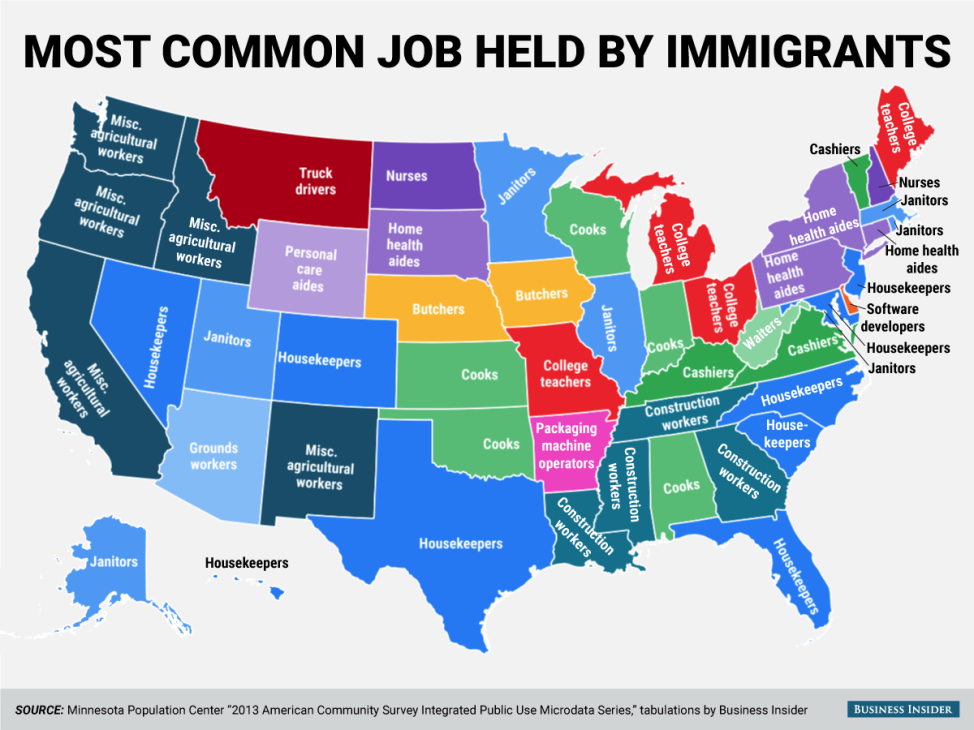
A choropleth map is a map in which the areas are shaded or themed according to the measure of the variable being displayed on the map.

We have been using such maps often, for representing population density, electoral votes, GDP income and more.

Advantages

  • It provides an easy way to visulize how the values of a measure are changing across the area
  • They are useful to visualize two variable decisions like the electoral maps. It can clearly indicate the colour differences and hence reading the map becomes easy

Disadvantages

  • When using maps for multiple ranges, it becomes difficult to distinguish each value. For eg: Using choropleth maps for Population density, differentiating the shades for similar values of population density becomes difficult.
  • The intervals need to be chosen carefully to depict a color change

Cartograms

Cartograms are maps in which the size of a geographical area is drawn proportionately to the value of data it contains. For eg : For mapping the popultaion density of different states, since New York has the highest population density, the size of New York will be considerably bigger than it actually is geographically.

Advantages

  • Cartograms are good at showing the relationship between spatial units
  • They give a clear idea about the size and the value of the measure

Disadvantages

  • Sometimes they become difficult to read as the shape gets distorted
  • Not sure about what to do with 0 or negative values
  • More data is needed to plot the states/regions as polygons

I have been doing a project which deals with Population density. I tried my hands on generating a Cartogram in tableau, and it required far more efforts than plotting a choropleth map. Cartograms definitely size the data accordingly, but recognizing becomes difficult as labelling in cartogram is tough.

Personally, I would stick to Choropleth maps for a basic map and then use bubble chart to visualize the regions according to the size, where each bubble would represent the value.


References-http://www.clearlyandsimply.com/clearly_and_simply/2015/04/cartograms-in-tableau.html


The Real difference between Google and Apple

Both Apple and Google are powerful and successful companies driving today’s cutting edge innovation and technology. The below visualization talks about the patents obtained in both these companies and how it translates into their organization structure.

Right: Apple Left: Google

Argument: Apple has a more centralized organization structure, originating from it’s well known design studio. Google, however has a stream of distributed open source approach to their new products.

In order to prove this difference in organization structures, a data visualization company, Periscopic charted the last 10 years of patents filed at Apple and Google as a complex network of connections.

Understanding the visualization – Each blob is a patent inventor. As many patents can have multiple inventors , each line is a link between the inventor and the co-inventor. While Apple’s viz looks like multiple blobs scattered across, Googles’ viz looks more like a monotonous single blob which is evenly distributed.

According to the patent data, in the last 10 years:

  • Apple has produced 10,975 patents with a team of 5,232 inventors.
  • Google has produced 12,386 patents with a team of 8,888 inventors.

The proportion of patents seems to be similar, however, there is a group of highly connected experienced set of inventors at the core of Apple, however for Google its more evenly dispersed. This translates to a more top down, centrally controlled system in Apple. Google on the other hand has a more flat organization structure with many teams having experienced inventors.

KPI – Average number of inventors listed per patent.

  • Apple – 4.2
  • Google – 2.8

Because of even distribution of patents at Google one is bound to think that the average number of inventors listed on a patent should be more in Google than at Apple (from the above visualization). However, the underlying data denies this. On an average an inventor in Apple produced twice the patents than an inventor in Google.

Audience for the visualization – Periscopic helped develop a product called PatentsView which is a visualizer for American Institute for Research and US Patents Trademark Office.

About PatentsView – It transforms the patent database which is made public for over a century, into a viewable network of connections. The patents, can be viewed by company or can be sorted according to the creator or topic.

Main Intention – According to the CEO of Periscopic, they wanted to utilize the publicly available patent data to find interesting patterns and also inspire others to explore this data.

Reference: https://www.fastcodesign.com/3068474/the-real-difference-between-google-and-apple


Working Mothers

Working Mothers

The Visualization “Working Mothers” is a good example of interactivity with usage of different tableau features but  it is too general and lacks claim, argument, predictions etc.

The visualization shows the percentage of working mothers from 1860 to 2010 in US, there are 3 different charts, two for comparing 2 years and another showing change in the ranking for the years selected. We can select the years using a slider. All three charts are dynamically connected. 

What I like 

  1. Slider bar to select different years for comparison
  2. Interactivity between all three charts
  3. Showing of ranking and its increase and decrease at the same time, using lines

What is missing 

  1. If Region level data is included, the audience can see the variation of working women over the course of time across regions like south, south-east etc. 
  2. The visualization compares just two years and there is no way to see the variations across time and comparing the same to two different regions/states can add an argument/claim to the visualization
  3. Audience – The audience to this visualization is not clear 
  4. Claim – There is no claim, for ex –  there has been an increase of working mothers after 1950
  5. Argument – the Visualization is not making any argument like “x” state has more working mother 
  6. Action and Prediction elements are missing, it would be a nice add on to predict number of working mothers over the next 50 years

For the above even though the visualization makes use of cool tableau features it lacks in the essential elements like Argument and prediction.

Source -https://public.tableau.com/profile/adam.davis5609#!/vizhome/WorkingMothers/WorkingMothersStateRates

Should I use Donut chart?

Donut chart shows relationship of parts to a whole but it is important to think if it makes any sense. Just because it looks cool, most of the times it doesn’t tell you much. It depends upon what you want to convey. For example, if it is related to gender ratio or performance of one entity overall, then donut chart will be the best fit. But if you have many entities to display then it may become chaotic.

Image-Source: http://payload.cargocollective.com/1/2/73104/1481815/Pie-Labeled.jpg

The above donut chart displays food consumed in 2010. It is eye-catching, labeled properly with different colors. I would like to comment over some of the issues with this donut chart.

  • When you look at each food product you can get its percentage contribution. But it is hard to compare them with each other. You cannot identify minute differences. The contribution of Veggies and Pasta looks similar but there is difference of ~3%. This can mislead the results. While comparing, user has to remember the values for each item causing inconvenience.
  • Use of different colors is confusing the user especially for color-blinds. It is hard to distinguish Soup, Salad, Fries and Sushi. They all look same.
  • Lower values are not visible at all (Salad, Sushi).

It is possible to transform this messy donut chart into meaningful graph. Simple bar chart will be the better alternative in this case. User can easily identify items and compare the values. No need of color palettes in this case. Bars are easily distinguishable. For the lower values, you can combine them together in one item as ‘other’. If you want to use color palettes, then you can even make categories as ‘Fast-food’, ‘Veggies’, ‘Meat’.

While creating a visualization, we should find to make something that looks cool but does not sacrifice a bit of analytical clarity!

Source:

http://payload.cargocollective.com/1/2/73104/1481815/Pie-Labeled.jpg

http://www.datarevelations.com/with-great-power-comes-great-responsibility-or-think-before-you-use-a-donut-chart.html


Interactive Visualization- 5 Key Properties

Interactive visualizations are often used to show insights from the data sets. It gives the user to select filters and view the data to see patterns or trends. But creating interactive visualization can get tricky. The following key points should be followed while creating a dashboard-

  1. Ease of understanding for Novice User: A new user who does not have a full understanding of the data set must be able to do analysis without wasting much time on the visualization. They should be able to understand the trends, correlations and anomalies using the tool and make faster decisions based on the visualization.
  2. Driving Processes: The visualization should highlight the KPI’s and important metrics which drive the business processes. They must be visually enhanced by using right kind of colors or patterns which makes it easier for the user to identify them. The representation should be simple but granular as well so that no vital information is left out, but it is also easier for the user to make sense out of it.
  3. Data must tell a story: The data should be analyzed in such a way that it unfolds a story. The user by applying appropriate filters should be able to see different perspectives leading to a decisive conclusion. The interactive dashboard should be such that is gives a high level overview and takes the user to granular details of the data.
  4. Data correlation: On viewing the visualization the user should immediately be able to identify the hot spots which need immediate actions. They should be able to find trends in the data set by viewing the relationship between different data streams and different data sets at times.
  5. What next?: Every data visualization should comment on what could happen could happen next? By using predictive analysis, some predictions should be made about the trends in the future. By using calculations and algorithms the data analyst can give some recommendations about the future of the data trend.

Source: https://www.forbes.com/sites/benkerschberg/2014/04/30/five-key-properties-of-interactive-data-visualization/#1f83815e589e

What is a Data Visualization’s Goal?

The ultimate goal of data visualization is to make it easier for management teams and the business people to make informed decisions. Data visualization makes it easier to analyze a set of information. With background information, business objectives and business goals, visualizations provide an additional context.  With a good visualization you can point out areas of improvement, areas with potential, weak spots etc. They provide a way of communication that can be easily understood by the audience, saves time and leads to informed decision making.

Hence, it is very important to be critical and ask yourself – What do you want to represent with this visualization? Is it making sense? Is it easily understandable? Does it convey the right meaning? For example, lets consider this visualization below –

https://www.theguardian.com/news/datablog/gallery/2013/aug/01/16-useless-infographics#img-4

This a radar chart that is designed to assess cars by comparing different car features against each other. This is a classic example of eye beats memory. It is confusing and difficult to understand.

  • What do the different colored lines symbolize?
  • The colored lines used to connect the different features are highly confusing and difficult to make sense of.
  • While comparing one feature to another, you constantly need to remember the value of that feature to another.
  • Don’t even try comparing multiple features, it will require you to really squint your eyes and maybe create a table just to understand what’s going on!
  • I don’t know what how to judge whether each feature is good, average or bad? How do I define that?

The creator of this visualization did not think whether this visualization will help or hinder information analysis. There was no thought put into how it will prove to be an effective tool for decision making. In my opinion, it is a pointless visualization. What do you think?

Source –

https://www.theguardian.com/news/datablog/gallery/2013/aug/01/16-useless-infographics

Week 7 Views.

The map below shows the most common jobs per state, held by people who are from a non-US origin. Though the data is not quite clear on if the people are legal or illegal immigrants in this scenario, we can see that, 59 percent of the workers have lower than a high school education, compared to 31 percent of the rest of the labor force. (Mekouar, 2015)


This visualization contains a lot of data and could be represented in multiple better ways.

The main issues I would improve are:

Firstly, the representation of color and labels make the map look cluttered.

  • Having a legend would improve the above flaw to a certain extent.

Secondly, grouping the states and indicating the common jobs by % would present the data to create a better understanding.

The last thing according to me that would make more sense is to classify jobs by skill level and create an understanding on the education levels and the wage details.

As the weeks have passed, I have learned to appreciate and criticize details of each visualization. To create better and more influential visualization/ dashboards we should first ask the question “Why is it required?”. This has given me an understanding of how to better justify the data to your audience than just making an attractive visualization.


http://blogs.voanews.com/all-about-america/2015/08/24/most-common-jobs-held-by-immigrants-in-each-us-state/

Rules to Make Dashboard Simple

Dashboard should only display information relevant to your objective. In order to make dashboard simple, it is necessary to avoid four factors as following:

Overuse of color – Using every color of the rainbow isn’t necessary. Too many colors can be distracting and confusing. Also, don’t use colors that are to similar. If using different shades of the same color, make sure the shades are different enough to distinguish at a glance.

Logos –  Unless sharing the dashboard with outside partners, users should know their company. Including in the company logo only takes up space that can be used for something more important.

Navigation- If you have to split up the information into multiple windows or use scroll bars to view a full graph or chart, you run the risk of users missing key information. Did you choose the most important metrics? Are you creating a data puke?

3-D Element – The colors, shadows and axis inclination can easily skew the interpretation of the data. It’s better to keep it simple and stay 2-D.

Guide Lines & Borders – These should be used sparingly, when the context is absolutely needed.

How to Create Effective Dashboards: 3 Best Practices

Interactivity in Tableau

Tableau is good at creating visualizations for us using a few-clicks. However, when it comes to interactivity among visualizations, we have to do it all by ourselves by using the features provided in Tableau – this can be a daunting task (as evidenced during assignment #3 🙂 ). To make our lives a little easier, let’s take a quick look at some of these features and see how we can use them for our speed violations data set.

Filters are one of the most basic interactive feature that can be used in Tableau. They are primarily used to engage the user’s attention to a subset of the data. Let’s take a look at how we can add filters to our visualization:

  • Using Keep Only/Exclude option: Using this option, the user can select the data points which he/she is interested in and then keep those only in the visualization for deeper analysis. This can be achieved by selecting the data points in the visualization through several clicks or dragging and then choosing whether to retain (Keep Only option) the selected data points or exclude (Exclude option) them from the view using the Tableau prompt. As an example, say we have the map for Chicago with the addresses marked as per violations reported. The user can focus on different parts (for e.g. north, south, east, and west) of the city by selecting addresses in the region and then using Keep Only option for further analysis.
  • Using filter shelf: The user can drag different dimensions and measures into the filter shelf to apply a filter. This option gives the user a wide variety of options, such as range, condition, wildcard, etc., to apply the filter depending on the parameter which is being used. Let’s take the same example which we used above, the user can do a wildcard filter for addresses having the string “N WESTERN” in it (there are seven unique addresses with this string in our exercise data set!).
  • Interactive filter as a card: The user can be given the ability to filter in/out of the dataset by having an interactive filter card along with the visualization. This can be achieved by clicking on the drop-down menu for the field in either the row or column and then select “Show Filter”. This will open up a filter card for the selected field, next to the visualization. Using the same example, we will have a filter card with options to select “All” the addresses or individual ones. This filter can be modified to be presented in various ways such as “Single Value”, “Multiple Value”, or “Wildcard Match”.

We will take a look at sets, groups, and actions in the upcoming blogs!

References:

Dashboard doesn’t always need to be fancy

Finally creating dashboard visualization comes to the topic in the class lecture. Good visualization speaks louder than words.

There are many good examples of how to make good visualization for corporation business performances. However, here I’d like to share what I learned from a dashboard that representing Indianapolis Museum of art performance(link).

  1. Dashboard doesn’t need to be filled with all different charts. All charts are in the same size, same format in this dashboard but they emphasize each chart with information-oriented icons and clear measure words. Smaller fonts for Word explanations also help readers to have better understanding about their performance.
  2. Numbers and icons could replace fancy charts. There are no single fancy charts in this dashboard. Highlighted numbers and relevant icons replace the charts. It provides brief information about the entire business picture.
  1. Transparent data is worth to present. For some company they don’t need to show the analytical data but only summarized final data. Each single data is very transparent and self-explanatory by itself.
  1. Clear highlight help readers to focus on the topic. Here they highlighted number with red color and words with black color. Same color for the highlight clearly comes to reader’s eyes. It unifies that chart to one theme in a sense.

Reference:

  1. http://www.dashboardzone.com/museum-dashboard-a-dashboard-with-no-fancy-charts
  2. https://www.kaushik.net/avinash/digital-dashboards-strategic-tactical-best-practices-tips-examples/