Using interactivity to explain a complex topic: Why Buses Bunch

We have seen countless examples of visualizations that represent business data i.e. they show metrics or provide a viewpoint. However, another very important use of visualization is visual discovery. We can use visualization to explain complex topics using techniques such as storytelling or gamification. One such example is the visualization that I am talking about in this blog. The visualization here explains what “bus bunching” is using a simple visual game with analytics. Before I critique the visualization, let me explain what “bus bunching” means. This phenomenon occurs when there is a delay in the arrival of a bus, followed by multiple buses to arrive in quick succession later.

What I liked in this visualization?

  • The example taken to explain this topic is a very simple one – two buses and four bus stops. The start point in this visualization is something which any one with zero or little knowledge about the topic can understand. However, the author has provided options to complicate the scenario by adding interactivity. This is achieved by clicking on the interactive dashboard which shows the bus number and the passenger count.
  • The user of this visualization can also get information regarding history of passenger wait times by viewing the area chart which appears when we hover over any of the bus stops.
  • The instructions are laid out in a clear and concise manner, without disrupting the user’s attention.
  • There are also interactive provisions to play/pause/reset the phenomenon.

What I disliked in this visualization?

  • The visualization does not help account for passengers in/out. The count of passengers at bus stops usually varies, but this has not been accounted. Hence, we can only see the phenomenon of bus bunching.
  • The bus stops have multiple data points (in circle shape) that come up when we play this game. However, it is not clear as to whether that is the total number of passengers that get in or out at that stop.

I would like to mention that these kind of visualizations should be used for educational purposes in order to simplify complex topics. For these kind of visualizations, the selection of visualization tool is very important since traditional idioms, such as line/bar/area chart, may not work and it is very challenging to create custom idioms. For such scenarios, we have visualization languages such as D3.js to help in creating innovative idioms like the one explained in this blog.

References:

http://setosa.io/bus/

Should I learn more visualization tools?

In the recent years, the internet has seen a surge in the number of dashboards and visualizations – some that communicate a message succinctly yet far too many that are colorful and pretty but don’t serve their intended purpose all too well. Thanks to the availability of data and the proliferation of “big data” visualization tools, it has become extremely easy for data enthusiasts – both amateurs and experts alike to create dashboards and share them across the web. While the growing enthusiasm about data visualizations is definitely encouraging, it is important to better understand the framework that underpins a great visualization to make a meaningful impact. The problem begins when we skip learning concepts and jump directly to learning tools.

Personally, until a few months back, I was under the impression that I could learn the art of visualizing data by simply learning a tool such as Tableau or QlikView. However, over the course of the past few weeks, I have come to realize how important it is to understand the underlying foundations and frameworks to create an effective visual that truthfully communicates a trend or a claim. For example, I’d never given too much thought into who my audience was and how my visualizations were driven by them and not the other way around. It is worth noting that the fundamental concepts of visualization and framework remain the same, no matter what tools we use. Hence, tools without frameworks are mere tools that serve little purpose.

Reference:

www.daydreamingnumbers.com/blog/learn-concepts-not-only-tools/

5 TIPS FOR CREATING EFFICIENT WORKBOOKS

  1. Think strategically about the data you absolutely need. Reduce the size of the data set by removing irrelevant data from the file. For example, dropt the data three years ago, if your analysis is only about current year. This may help you remove at least one-third of the data before you started. You may also use aggregation to reduce the number of records. Prepare data before it gets to Tableau.
  2. Limit filters. One way to reduce filters on a dashboard is to use dashboard actions instead. Using a sheet as a filter or adding a filter dashboard action that runs on hover or select provides a more efficient means for filtering the rest of the dashboard.
  3. Reduce the number of marks. The more marks that need to be processed, the longer it may take for the visualization to appear. Depending on your analysis requirements, it may not always be possible to reduce the number of marks on a view, but sometimes there is an opportunity to change the level of detail to improve efficiency. Consider ways you can aggregate data points into hierarchies and / or make the analysis less granular.
  4. Efficient Rule. While the calculations are very powerful, they can come with a cost to the efficiency of the workbook. Not all data types are created equal in terms of efficiency, with data types going in this order from most efficient to least efficient: Boolean > Integer > Float > Date > Date Time > String
  5. Reduce sheets, dashboards, data sources. This tip not only helps with efficiency, it will help you keep your sanity and improve the end user experience. If you do have several dashboards that are connected, create a navigation dashboard that helps the end user locate the most relevant views for their specific business questions. This same technique can be used from within specific dashboards (i.e. add a URL action to run on Menu that links the end user to another dashboard / additional information).

Reference: http://www.evolytics.com/blog/tableau-201-5-tips-creating-efficient-workbooks/

Ways not to use Tableau

Till now we have seen many ways in which Tableau can be applied to Data but Users tend to utilize it in the wrong manner and expect it to perform operations which are not a part of its applications. Let us look at some of them and identify ways to avoid it.

  1. Using Tableau as an Online Excel: Many users try to convert Excel spreadsheets to Tableau worksheets and publish it on Tableau Server so that other users can interact with the data using filters. But all the features of Excel cannot be replicated easily into Tableau so the users tend to blame Tableau for not having the necessary functionalities. Tableau and Excel are not built to do the same work and therefore have different and compatible features. Solution: Static table-like reports should be created using Traditional BI Tools and the dynamic visualizations and dashboards should be generated using Tableau.
  2. Building business applications on top of Tableau: Tableau is not a document or project management tool or a collaboration system for applications. Solution: Tableau should be utilized for Data Analytics and Data Visualizations and Development Team should be used for creating custom applications.
  3. Using Tableau desktop as an ETL Tool: Users export data from Excel file, do the calculations that are easier in Tableau and expect to import that Tableau data back into an Excel file and analyze it further. This is not possible and it is seen as a shortcoming of Tableau. Solution: ETL should be executed using tools like Alteryx, Informatica, Microsoft SSIS and Pentaho and Tableau Users should stick to Data Analytics and Visualizations.
  4. Exporting Tableau dashboards to PDF or Image: Users export the dashboard as a PDF or an Image to include it in a static text document which makes it lose its interactivity. Solution: To retain the interactivity of the dashboards and share it, use Tableau Server or Tableau Online to avoid pitfalls in decision-making.
  5. Unlimited Tableau Reader Users: Analyst Users tend to share Tableau workbooks in a production environment on day to day basis with many users. This involves company-specific data and has the risk of leaking outside the company. Every day the data is refreshed so the analyst has to send the updated workbook again which makes it a cumbersome task with many risks. Solution: Tableau Server and Tableau Online should be used to publish and share interactive dashboards and to avoid the risk of leaking data.

Tableau is not a data creation and a table production tool and should not be used for modifying or modeling data. Tableau users should connect it to raw data and harness its capabilities to produce dynamic visualizations and dashboards using suitable Data Analytics.

Source: https://www.linkedin.com/pulse/five-reason-how-you-should-use-tableau-hrvoje-gabelica


Visualizing Big data in Healthcare using Circos

The healthcare field has always been a favorite for analyst and data experts. The field is abundantly rich with large data sets and values, what we now call the “Big Data”. Analyzing large and multi-dimensional data in the field of genetics, genomes and biotech has always been a challenging task for analysts.

Most of the times, clinical data sets have a lot of fields and unstructured data. Healthcare data visualizations can be tricky and need utmost care in selecting the relevant data fields, measures and indicators. Because there is so much data involved, its structuring and visualization is a challenging process in itself. In a pile, full of insights, understanding the business needs of the clinical data and presenting them becomes difficult for technical experts like us. Data could be of various types like DNA types, Gene types, genome classification, disease virus classification etc. The person involved in creating visualizations and analysis may or may not have been acquainted with these terms biological and its significance. Hence, analysis of healthcare data becomes even more difficult. With various tools and software available in the market for data visualizations, one of them has stood out in terms of health care data.

Circos is an open source software package for visualizing data and information that visualizes data in circular layout is mostly advertised for data visualizations that have complex relationships between objects or positions. Circos is ideal for creating visualizations and illustrations with a high data-to-ink ratio [1] and multi layered data attributes making it ideal for clinical data analysis. Thus, for a data science professional in the field of health care and biotechnology , Circos is touted to play a very important part in making their tasks simpler.

References: http://circos.ca/

http://www.mastersindatascience.org/blog/10-cool-big-data-visualizations/


How Deceptive are Deceptive Visualizations?

Data visualization is a powerful communication tool to support arguments with numbers in a way that is accessible and engaging. However, the influx of poorly designed and misleading deceptive data visualization can be dangerous and we have to be careful of the pitfalls.

So what makes a deceptive visualization to be deceptive? I am happy to share with you a blog about deceptive visualization I read recently when I tried to find some inspiration on my own project work.

  1. manipulation of axis orientation/scale

as you can see here, the right side visualization has been truncated in Y axis, which makes the audience has the wrong impression about the difference between X and Y.

2. Area as Quantity (Message Exaggeration)

Alway be careful when you encoding quantitative data with size. If you map the data (quantity ) into the wrong way, say, use radius rather than areas, the result can be exaggerated seriously.

3. Inverted Axis (Message Reversal)

The x and y-axis are put upside down. This distortion leads to reversal of the message rather than an exaggeration or understatement.

Reference: https://medium.com/@Infogram/study-asks-how-deceptive-are-deceptive-visualizations-8ff52fd81239#.bi0qi7zax


Visualization Critique: Graph published by Wired Magazine

For my last blog, I have picked a visualization selected by Bill Gates to be printed in Wired Magazine that he guest edited. He might have his own reasons for choosing this visualization but I see many downsides with this graph.

To start, the audience can infer that the green section representing injuries is significantly smaller than the other two, but it is difficult to judge the relative sizes of the other two sections. Similarly, inside the yellow/pink/green box, it is easy to spot the larger rectangles and get a sense of their relative sizes but again we cannot accurately compare the diseases.

Also, it is easy to read names of diseases in large rectangles but it is straining to the eyes to read inside the small boxes. In addition, few rectangles do not even have a reference label. Even though they appear to be minor causes of untimely death, a designer should not leave out information just for aesthetics of the graph.

Next, I do not understand the need of three different colors. All three colors are segmented similarly in the legend so what is the real need for using too many colors? The same could have been achieved by using just one “stepped” color scheme and separating the three major segments with borders.

Lastly, the 3-D effect doesn’t provide us with any information and on the contrary makes the treemap harder to decode. Another problem induced by this effect involves the darkened colors that appear on the sides of the treemap to represent shadows, which are meaningless and misleading

Solution:
My recommended solution would be displaying the information that appears on the treemap in a simple bar graph. This would convey the story accurately, clearly and would be equally engaging.

References:
Article: https://www.wired.com/2013/11/infoporn-causes-of-death/

Note: Refer article for the visualization

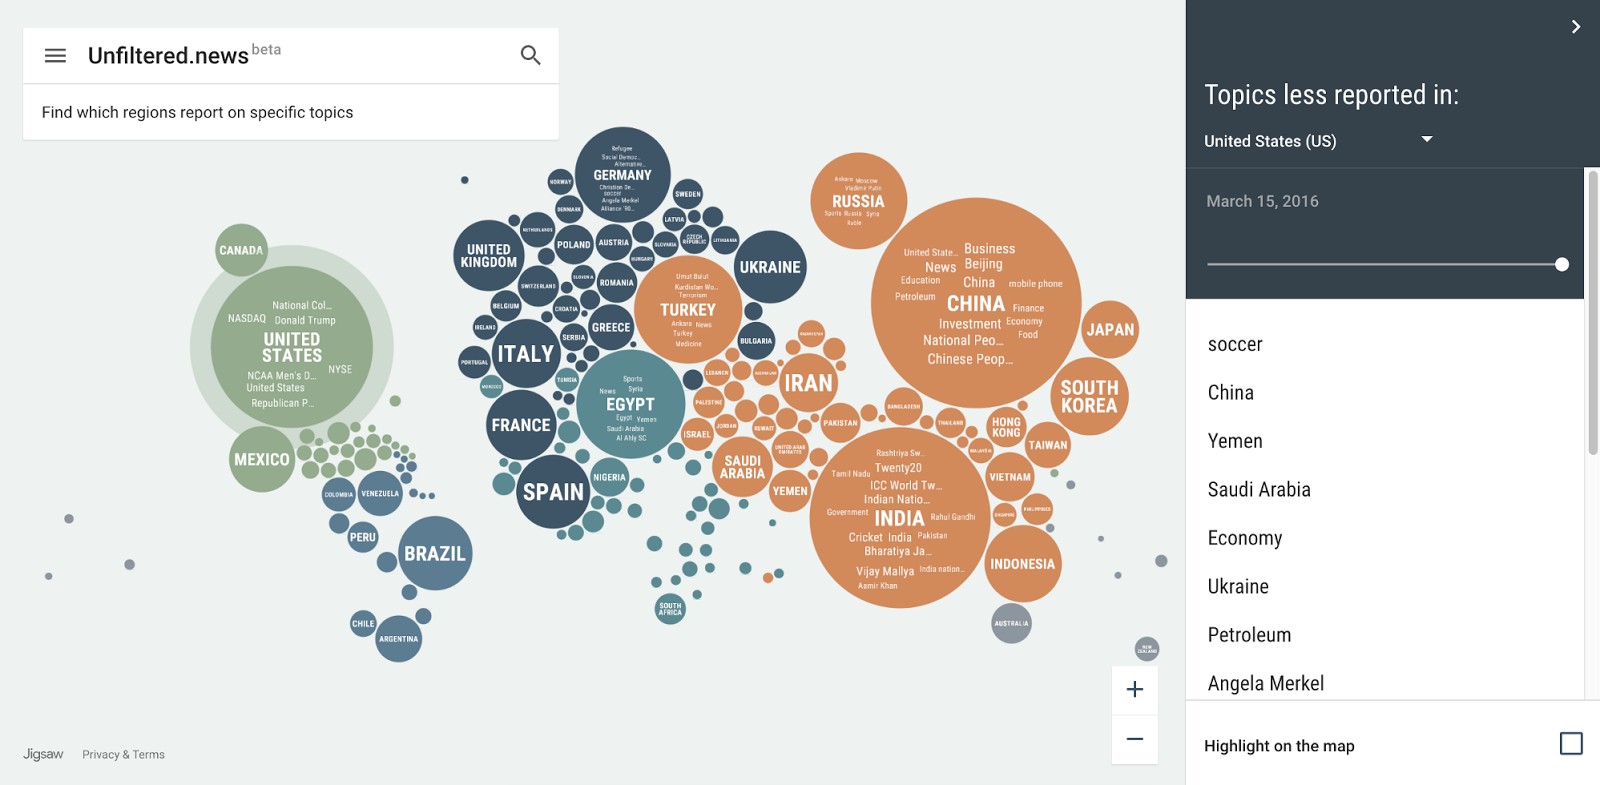
All News Around The World In 1 Visualization

Unfiltered.News is an online interactive VIZ which visualizing the data from Google News, which watches more than 75,000+ news sources writing in 38+ languages worldwide. The goal for this visualization is to allow you exploring the news worldwide to find the topics and viewpoints that may not be covered in your location.

The visualization adopts an innovate idiom which combines the classic idiom of word cloud and bubble map. Each bubble represents a location or a country in the world and each word within a bubble represents a news topic in that location. Both the mark of circle and word has the channel of size. The size of a word represents the number of times that a topic has been mentioned in the specific date within a given location. The size of a circle is determined by the total number of topic mentions from publishers located in that location.

I believe the viz could help anyone to better know what’s happing around the world. However, the news topics shall be categorized and applying filters on it, which could help user target the news they interest in more easily.

Reference:

https://medium.com/jigsaw/if-you-are-reading-this-we-might-be-in-the-same-news-bubble-cb697270c698#.p2njeouxy

https://unfiltered.news/about.html


Average Income and Education

Introduction

The interactive visualization appeared in Washington Post. It aims to understand the average income and the number of people with colleges in different neighborhoods searchable by postal code.  It shows the comparison between US national average and selected zip code average in the fields of income and education.


What I like


  • Usage of both map and a text box to select the zip code for which I need information
  • Usage of colors to differentiate different ranking of zip code based on income and highest level of education. Yellow being the highest to blue being the lowest


  • The information is present for the entire US which is a good thing as I can compare any zip code
  • Zoom out and zoom in feature which helps in easy maneuvering of the map


What needs improvement

  • Wastage of space for the map
  • Information present is less
  • No comparison between different zip codes, you can only compare selected zip code with national averages
  • A lot more information can be added like race, ethnic backgrounds, crime rate etc, this would have given even more insights to the income/ education to other factors.


I would like to conclude by saying that although the visualization does not talk about a claim or action or audience, it is a excellent data discovery tool for anyone who is interested to make targeted decisions based on the income/education details like a new marketing or development activities.


Source – http://visual.ly/washington-world-apart?view=true


The Snowball of Debt

With varying debts across the countries after global recession, people have been questioning its implications. To answer this question, blogger Simon Kuestenmacher created the Snowball of Debt. The visualisation measures the amount of debt for a country divided by its population, indicating the amount every individual owes to his country’s national debt.

From the figure, we can see that Simon has cleverly combined colours and visual aids to illustrate varying data. The maps of the countries have been carefully placed around the centre based on the amount its individuals owe to the country. Since, the people of Japan owe the highest debt, this country has been placed in the centre. Similarly, with the lowest debt owed by its people, Liberia occupies a position in the far end of the circle.

The countries have been given different colours based on public debt as a percentage of GDP. This also helps to categorize each country based on their economy and an individual’s capacity of payback. The trend in the chart is pretty clear: Wealthier nations have higher debts with its people owning more to their country. the countries with lowest debt owned per person are relatively poor. The reason for this could be the lack of opportunity for these nations to take national debt due to the unwillingness of investors to offer them loans.

A lot of conclusions can be drawn and a lot of information can be retrieved from this figure. The user has aptly applied the principles of aesthetics to his idiom by keeping the visualisation attractive and equally informative.

Reference: http://www.freshplaza.us/article/7756/The-snowball-of-debt.