Blog 1 — Hits for the search term ‘Obesity’

I found this graph in the article could “Obesity: Are We Food Obsessed?”. The author wants to use this graph to prove a statement written by Professor Greg Whyte that, when facing with obesity, people are more focused on the diet rather than the physical activity, but they share equal importance.

This graph shows the search rate for the words related to obesity. It is very clean and simple, which gives the audience a direct view at the first glance. For example, we can easily see that diet has the highest rate. However, this graph is not so clearly, which will mislead the audiences.

First, there are two items on the top right – Pubmed and Google. I think these are the two search engines the author wants to focus on. But these two items have two different units, seconds and millions. In my view, million is the for the hit rate. What does seconds stand for confused me a lot.

Second, there are four colors in the graph. Two for Pubmed, two for Google. I’m also wondering, what’s the differences between two colors for the same item. It’s unclear. In other words, the author didn’t give enough information in explaining the meaning of colors.

Third, the title of this graph is missing some parts. The author uses ellipsis after the words ‘Obesity’, which will confuse the audience whether the author is focusing on anything else.

Overall, this is a good graph that clearly shows the results on hits for the search terms. It tells the audiences what the author is looking for, why he thinks in that way and how the results prove the statement. This graph also leads the audience to think in a different way that they focus more on the diet when losing the weight than doing the physical exercises, which might not be right.

Source : http://blogs.discovermagazine.com/neuroskeptic/2012/03/24/obesity-are-we-food-obsessed/#.WOwDslPys_W

Post-Drought Employment of Santa Cruz County

By: Jacob McConnell

In the local Santa Cruz newspapers, journalists express their joy as the winter storms slow and Spring season begins. After a multiyear- historic drought in the bay area, the winter of 2016-2017 brought massive amounts of much needed rain and within a few short months, officially put an end to the worst water shortage in state history. I, along with the rest of Santa Cruz county am grateful for the relieving effects of the successful winter. While I do not intend to undermine the severity of the drought, I have began noticing articles and statistics that seem skeptical in regards to the actual positive impact the rain has had on our community.

What caught my attention were a few graphs of the labor statistics of Santa Cruz County intended to highlight the increase in labor force at the end of the drought. Below is a snapshot of the Santa Cruz County Labor force depicted over the first two months of 2017.

At a quick glance, the graph displays a steep and steady increase in employment. The line actually increases 4-fold within the presented graph. However, simply looking at the numbers on the y-axis one can notice that the actual number of employees that joined the workforce was less than 1000. Out of the 131,250 workers, this increase is actually less than an 1% increase in employment. Admittedly however, if kept steady, this would result in an over 6% increase in employment for 2017, which would be very impressive.

After calculating this potential rise in numbers of the workforce, I too began believing the heavy rain quite possibly could be creating this increase in thousands of local jobs. The news mentions how our agriculture, flood and beach clean-ups, creek visits, landscaping, construction, and tourism were all benefiting from this winter. Though it is hard deny these claims, I noticed a trend in all the jobs being highlighted: they are all seasonal.

As a beach town centered around tourism and agriculture, some of Santa Cruz’s biggest producers of jobs are the beach boardwalk, the university, and the local farms. These organizations base large portions of their business on part-time and young workers. In order to analyze a trend in part-time seasonal work within Santa Cruz County, I pulled a graph of the 2016 labor force over the entire year.

By simply viewing this fully depicted graph, it can easily be concluded that there is a large spike in employment during the summer months. The start of 2016 is identical to 2017’s start shown in the original graph. It is hard to simply rule out the end of the drought as a job creator, but history shows it is more likely to be a seasonal trend in local employment rather than an actual positive impact the excessive rain had on the community.

Sources

https://data.bls.gov/pdq/SurveyOutputServlet

http://www.cityofsantacruz.com/departments/water/drought/weekly-water-conditions

http://www.cityofsantacruz.com/departments/water/drought/2015-water-supply-outlook

http://www.santacruzsentinel.com/article/NE/20170126/NEWS/170129769

Blog Post 1 – cchen2 – Poking a Monster Graph

Pokememory
How memory is used in each Pokemon generation

Overview

My first blog post is about this visualization of Pokemon Generation 1-6 data usage. For each generation, this graph broke down various actions a user can do and the data it consumes when in different modes (e.g. Playing, Battling, Catching…)

Impression

The trend of data usage in Pokemon generations is fairly consistent. Except Gen 5, all other generations use more data than its previous generation. At first glance, this visualization reminded me of Tetris, the classic video game a lot and it took me a while to grasp the interpretation of the graph. There are couple reasons why I had difficulty understanding the graph:

  1. Some boxes with the same color could appear next to each other or stack on top some other colored boxes. For example, in every Generation, blue boxes like EVs (bottom row) are also at the very top (HP, Att, etc.)
  2. There are too many segments in the graph. From 18 segments in Gen 1 to 70 segments in Gen 6, this graph contains a lot of data for its readers to process.
Tetris

Possible Improvement

I would address the two points above.

  1. Arrange the order of the blocks so different color boxes are displayed together.
  2. I will group similar segments in one category (e.g. Group Nickname, OT Name, and OT ID into one category called Name, and group unused and unknown to one block). And have another graph to show the percentage breakdown of each process in the categories (e.g. Name group: Nickname  – 60%, OT Name – 30%, OT ID – 10%).

Sources:

https://www.reddit.com/r/pokemon/comments/4cndbn/how_memory_is_used_in_each_pokemon_generation/

http://www.tetris24.com/

Alternative Dashboards

Justin Mungal

http://www.nytimes.com/elections/forecast/president

I remember the night of the 2016 presidential election hauntingly well.  Several friends of mine and I gathered at The Hut in honor of its historic closing and in celebration of Hillary Clinton’s imminent win.  Beers in one hand and phones in the other, we starred with our eyes glued to the bouncing needle on the NY Times live presidential forecast.  We could hardly steal a second to sip our beers because the needle on the dashboard kept bouncing left and right, edging towards Donald then retreating to Hilary, back and forth on “Chance of Winning the Presidency” scale, keeping us in endless suspense.   Little did I know that the previous polls indicating Hillary’s soon-to-be landslide victory were as false as the wavering needle of NY Times exit poll data.

Looking back on that night I realize I was being duped and deprived of enjoying my frosty brew, instead stuck to an incessantly moving  and meaningless needle.  Inspecting the data graphic now, I have no idea what I was even looking at that night of the election.  The categories the needle teetered between (very likely, likely, leaning, and tossup) are inherently vague.  The needles to the right depicting popular vote margin and electoral votes made sense – they showed numerical data, the needles moved according to incoming county data, and visually account for each incoming vote and their actual impact on the election results.  So what then does the category “tossup” mean, how many votes does it take to move from “likely” to “unlikely”, and on what basis does the needle move within a given category?  Later in an NPR podcast I would find out that the NY Times does not receive a steady stream of election polls data, which the continuously moving needle would indicate, but rather receives chunks of data from counties at various times throughout the night as their ballot casting centers close and compile the exit poll data.  The endlessly wavering needle was false and was programmed to keep viewers in suspense and glued to their app.  The true data, the two needles to the right (“Popular Vote Margin” and “Electoral Votes”), moved infrequently and did not require constant attention – offering an opportunity to close the app and put our phones down.

In the dawning era of “fake news” and “alternative facts” the American public needs, now more than ever, media stalwarts of integrity.  The New York Times has been known to be one of America’s most prestigious sources of news and must fight to maintain this privileged seat of honor.  Ironically, we are also entering an era of data driven news.  We have the capacity to collect, analyze, and visualize vast quantities of data quickly, informatively, and entertainingly.  In a world where each news corporation has its own spin on every story, data must be reverenced for its undeniable link to truth.  For the NY Times to report false and sensationalized data for the purposes of maintaining viewership is reprehensible and unfairly places the burden of discerning the integrity of data on ordinary citizens rather than on highly trained data scientists.  Given the dilution of truth in our modern Twitter chatter and Facebook news feeds of lies it is necessary that the historic bastions of reporting integrity recommit themselves to the noble profession of raising the bar for what it means to be an “informed citizen.”  In the advent of big data and visualization, the possibility of raising that bar to new heights previously unimaginable has become a reality.  We must not turn that reality into a fantasy by creating false data and misleading visualizations.  The consequences of such behavior – a president with ties to Russia, the disintegration of universal healthcare, the launching of fifty-nine cruise missiles on Syria, etc. – are indeed grave.

Formula 1 Data Viz


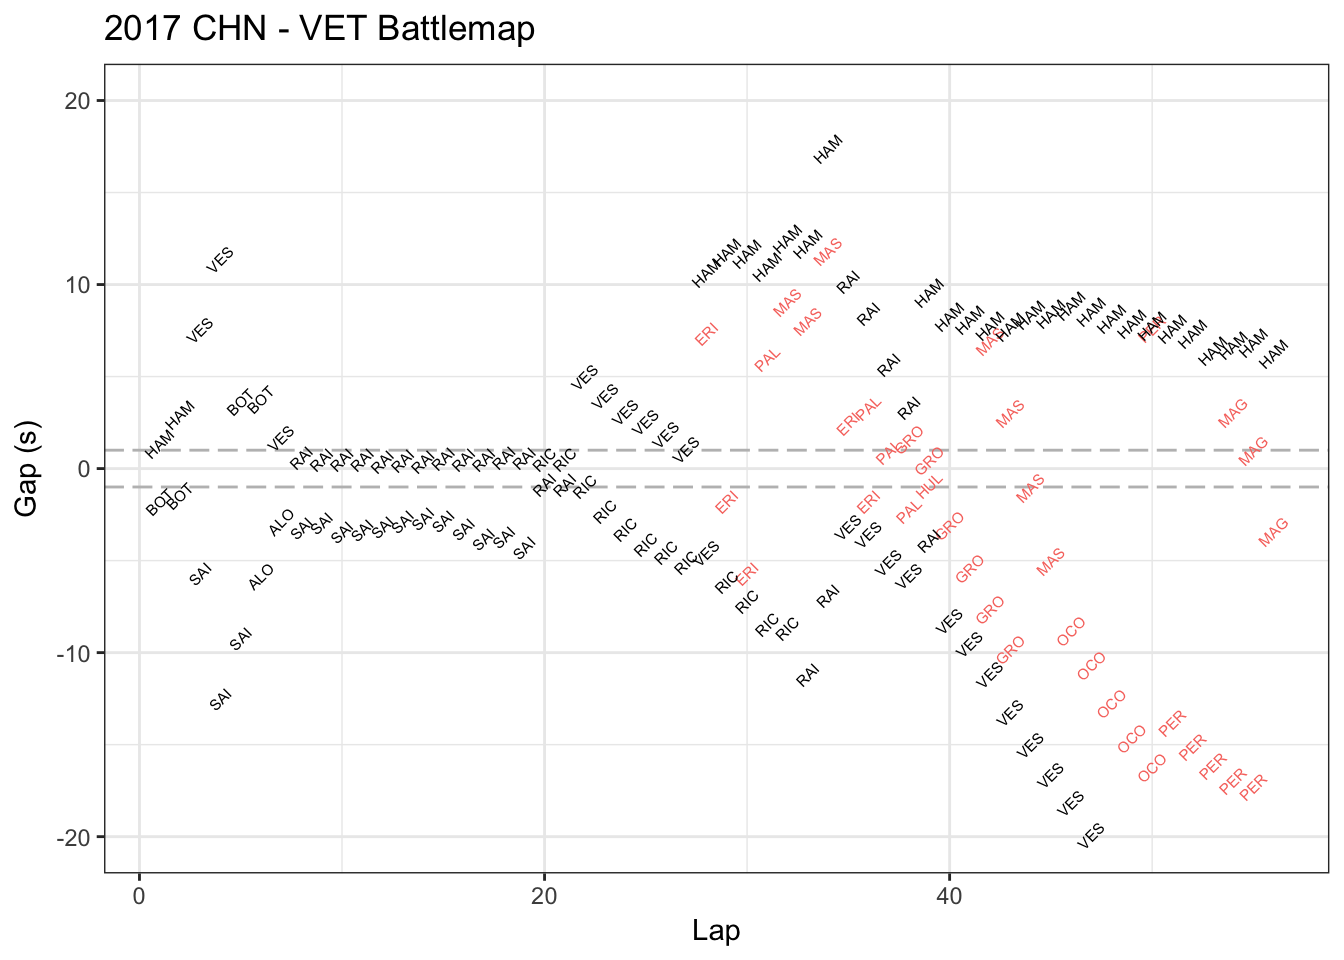
This is Vettel’s race battle map in China Grand Prix in Apr.9 2017. This map shows who’s ahead or behind Vettel and how much the seconds in each lap. The red data represents the players lapped by Vettel.

This map is not beautiful to me. Showing the player names again and again in the charts causes me dizzy. Also, I took over 3 minutes to understand what it is talking about, even I am familiar with Formula one and watched China Grand Prix.

It’s not functional to me, either. This graph only shows the closest one player ahead of Vettel and one behind Vettel, which makes me hard to compare key players (for example, Hamilton was the key player compared to Vettel in that game but he “disappeared” in some laps). Also, it did not show when Vettel stopped and how many times he stopped, which is very crucial because you may misunderstand the data (for example, BOT (Bottas) was ahead of Vettel around lap 3-4 because Vettel stopped but Bottas did not).

I got a functional viz in my mind: compare the lap time of two close players (for example Hamilton and Vettel), including tire types and its condition changes (mid, soft or super soft) using gradually transparent color when we show the lap time bar. This will give us a lot valuable information and reasonably to guess when and why there’s a lap time difference. Also, we can tell the difference of team strategies (Ferrari and Mercedes). Besides, there would be other interesting thing to watch like when they had similar tire conditions, who was the faster one?  Or we break lap into three sections and do some precisely comparison.

Sadly I cannot find players’ lap times data in that game, but I think they did – http://www.f1datajunkie.com/. Hope you can build some interesting viz to our F1 fans!


Lie with Truncated Y-Axis

Data visualization is one of the most important tools we have to analyze data. But it’s just as easy to mislead as it is to educate using charts and graphs. In this article we’ll take a look the most common way in which visualizations can be misleading.

Truncated Y-Axis

One of the easiest ways to misrepresent your data is by messing with the y-axis of a bar graph, line graph, or scatter plot. In most cases, the y-axis ranges from 0 to a maximum value that encompasses the range of the data. However, sometimes we change the range to better highlight the differences. Taken to an extreme, this technique can make differences in data seem much larger than they are.

Let’s see how this works in practice. The two graphs below show the exact same data, but use different scales for the y-axis:

On the left, we’ve constrained the y-axis to range from 3.140% to 3.154%. Doing so makes it look like interest rates are skyrocketing! At a glance, the bar sizes imply that rates in 2012 are several times higher than those in 2008. But displaying the data with a zero-baseline y-axis tells a more accurate picture, where interest rates are staying static.

https://blog.heapanalytics.com/how-to-lie-with-data-visualization/

CORE PRINCIPLES OF DATA VISUALIZATION

In a beautiful and apt analogy, Stephen Few, the Principal of Perceptual Edge encapsulates the purpose of data visualizations – Visualisations are just tools. Just as tools made it easier to build houses, visualization make it easier to portray complicated data. The purpose of visualizing data is served if and when it takes the burden of effort off the brain and puts it on the eyes. In order to accomplish that, he recommends a few core principles:

SIMPLIFY – Perhaps the most important of all, simplification of complicated data should be the first purpose of any data visualization. Choosing the apt type of representation and adding only the most essential/important of data helps in simplifying the complicated data. Care should be exerted to make sure that this does not come at the cost of oversimplifying and omission of important data.

COMPARISON – When using data visualization techniques to compare and contrast two sets of data, it is essential to juxtapose them to offer an easier comparison. Human brain finds it difficult to keep the comparison data in memory and it is cumbersome to have to turn back every other second for comparison.

ATTEND – Visualisation of data should be done in such a way that the audience process the most important data at the first glance itself. Highlighting the important part of the data or using tools and techniques to emphasize the principal parts would serve this purpose admirably.

EXPLORE – A good data visualization should enable the viewer to gather the data it was meant to portray just by looking at it. It should also be flexible enough to allow a directed or exploratory analysis with ease. A good visualization tool must be designed keeping this in mind as well.

DIVERSITY – A data visualization may have different facets to the data it is representing. Different views of the same data may provide different insights. The quality and efficiency of data visualization increase if it allows for the same data to be analyzed from different perspectives and to see the relation between them.

THE WHYs OF DATA – In addition to showing the data, an ideal data visualization should also encourage the viewer to find an answer to the reason/cause behind the distribution of data.

SOLUTION TO POSSIBLE QUESTIONS – Most of the time, viewers take in the data given in the visualization without any question. But a good data visualization should be designed in such a way that it would be able to answer any potential questions. This could be achieved by incorporating more filters and/or software.

In Stephen Few’s words, the best software is the one which you don’t realize that you are using. By putting these basic principles in practice, anyone can design such an efficient data visualization tool.


How the Recession Reshaped the Economy

The chart in this visualization appropriately shows that, five years since the end of the Great Recession, how the American the economy has regained the total of nine million jobs it had lost during the economic recession. The major part of this economic recovery was that not all industries recovered the lost jobs equally. Each trend line below shows how the number of jobs changed for a particular industry over the past 10 years. The claim of this visualization is that how the recession reshaped the nation’s job market, industry by industry.

Overview of the visualization

  • The creator of this visualization has categorized the jobs as per industry.
  • The legend in the plot appropriately shows the consequences of the jobs for about a decade. It has covered a vast range of jobs that were recovered and grown, jobs that were recovered to jobs that were declined due to a recession.
  • The X-axis shows the change in wages by industry and the Y-axis shows the change in the number of jobs since recession by industry.
  • The line plots accurately do this explosion thing showing breakdowns and highlights in the data.
  • On scrolling down, we get to see charts showing the trend of the job market by industry. The creator has drilled down to show the underlying information in detail and each chart shows that whether particular jobs of an industry have recovered and grown or only recovered or declined etc. Each chart shows the number of current jobs and the average salary for that job. On hovering over the line chart we get to see a number of current jobs and average salary changing as per the time period.


Conclusion

The created visualization follows the following principle of the visualization

  • Overview first
  • Function First, Form Second

Charts like this is helpful to predict the next financial crisis and build programs for recovering economy.

Reference – https://www.nytimes.com/interactive/2014/06/05/upshot/how-the-recession-reshaped-the-economy-in-255-charts.html

Benefits of Dashboards in the Business World today

Dashboards are extremely important in today’s businesses. Below are some of its benefits:
1. Total visibility into the business: You will know what exactly is going on in your business at all times with the use of a dashboard. How good were the sales last quarter/year, how is the marketing going on, how is the response of customers on the new product, etc. It becomes easy to compare such trends in the business.

2. Big time savings: The reports generated can be automated and live results can be seen. This saves a huge amount of time. This time then can be used for other useful purposes.

3. Improved results: You intuitively start improving your results once you see your key metrics on the dashboard. You start working better, trying to make that sales/profits graph go up.

4. Reduced stress: You can scan every aspect of your business to see how you are doing. If there’s a problem, you’ll know who exactly to contact to fix it. This increases easiness and reduces stress.

5. Increased productivity: You can measure performance numerically. When the employees see the results numerically, they naturally work hard to improve them. They try to make sure that they don’t have red arrows anywhere (a mark to show failure/doing poorly)

Reference:

6 Benefits to Building Your Dashboard Today

A Virtual Reality Guided Tour of 21 Years of the Nasdaq

The virtual reality tour of market data allows readers to literally ride the Nasdaq stock exchange through 21 years of growth and collapse. The “roller-coaster” conceit paired well with the Nasdaq data as it rose through the dot-com boom of the late 1990s and then busted. The slow recovery over the next 20 years culminated when it surpassed its previous peak, which is when this project was published. The visceral sense of height helps readers understand the precarious nature of the dot-com boom, and the plummet thereafter allows users to experience a sense of fear and uncertainty.

This project uses true 3D to allow users to experience an immersive world populated with this data visualization. users can optionally attach their phone to a Google Cardboard or any other 3D viewing device for a completely immersive experience that tracks your head movements and provides slightly different images to each eye, simulating real 3D. Without an attachment, readers can still move their phones in 3D space to view the 360-degree world. On the desktop, they can click and drag their mouse. Holding your gaze on a button triggers the action, allowing readers to bypass more complicated clicking interfaces.

The project is built using three.js, a relatively new library that allows programmers to render three-dimensional content in the browser. The data visualization itself was powered by D3.js, which was fed into the 3D environment.

Reference: http://graphics.wsj.com/3d-nasdaq/