Average Income and Education

Introduction

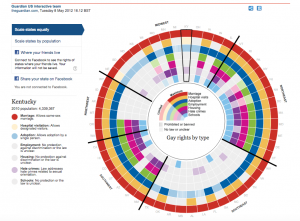
The interactive visualization appeared in Washington Post. It aims to understand the average income and the number of people with colleges in different neighborhoods searchable by postal code.  It shows the comparison between US national average and selected zip code average in the fields of income and education.


What I like


  • Usage of both map and a text box to select the zip code for which I need information
  • Usage of colors to differentiate different ranking of zip code based on income and highest level of education. Yellow being the highest to blue being the lowest


  • The information is present for the entire US which is a good thing as I can compare any zip code
  • Zoom out and zoom in feature which helps in easy maneuvering of the map


What needs improvement

  • Wastage of space for the map
  • Information present is less
  • No comparison between different zip codes, you can only compare selected zip code with national averages
  • A lot more information can be added like race, ethnic backgrounds, crime rate etc, this would have given even more insights to the income/ education to other factors.


I would like to conclude by saying that although the visualization does not talk about a claim or action or audience, it is a excellent data discovery tool for anyone who is interested to make targeted decisions based on the income/education details like a new marketing or development activities.


Source – http://visual.ly/washington-world-apart?view=true


Surplus Singles

Original Visualization

The visualization shows the data for surplus singles in the US. Gender is shown by the color and the size of the circle determines the number of surplus singles. This chart just shows the number of surplus singles, I believe the audience would be confused of how big or large the number is if they do not have an idea about the population of the city. There is no different chart for different age groups to have targeted claims.

Redesigned Visualization

This visualization was created to overcome the above disadvantages. The visualization shows the number of surplus singles for every 1000 instead of the actual number, this gives the audience more background of the “how many extra” singles. This gives a nice and clear information to the audience. This visualization also has Slider using which the audience can select the age group they are interested in, this would make the claim to be more targeted.
Usage of map, color and size of the circle is a very easy way for the audience to grasp what the visualization represents. By redesigning the visualization the author has solved the problem the audience had with the original visualization i.e. understand how many more unmatched for 1000 rather than just the entire unmatched singles.

NYC Street Trees

NYC Street Trees

The NYC Streets Trees is an interactive visualization created using jcanvas and jquery.

The visualization shows the numbers of different trees present in the five boroughs of NYC. The reason I wanted to talk about this visualization is because its creativity and use of customized idioms which i believe is mainly possible due to the usage of  jquery and jcanvas.

The visualization shows the different variety of trees present in NYC streets segregated by boroughs. Each borough is represented by a bar, the length of which represents the number of trees and  each bar is in turn is divided by the volume of different trees. The visualization is also interactive, if we select one tree then that tree is highlighted across the visualization.

Each tree is represented by a picture of the tree which would help the audience in identifying the tree when they walk the streets of NYC. We can clearly see that Queens has the most number of street trees and Manhattan the least which can be expected. Most street trees are Maples.


I believe that the visualization is unique in its usage of idioms which are customised by using jquery and jcanvas. I believe a similar visualization in Tableau would have restricted the author.


To Summarize even though the visualization is missing some key elements of claim, action, audience the author has done an excellent work in visualization using jquery and jcanvas and I could relate this with the discussion in class about using programming languages and separation of tool and task.
Source – http://www.cloudred.com/labprojects/nyctrees/#about

Working Mothers

Working Mothers

The Visualization “Working Mothers” is a good example of interactivity with usage of different tableau features but  it is too general and lacks claim, argument, predictions etc.

The visualization shows the percentage of working mothers from 1860 to 2010 in US, there are 3 different charts, two for comparing 2 years and another showing change in the ranking for the years selected. We can select the years using a slider. All three charts are dynamically connected. 

What I like 

  1. Slider bar to select different years for comparison
  2. Interactivity between all three charts
  3. Showing of ranking and its increase and decrease at the same time, using lines

What is missing 

  1. If Region level data is included, the audience can see the variation of working women over the course of time across regions like south, south-east etc. 
  2. The visualization compares just two years and there is no way to see the variations across time and comparing the same to two different regions/states can add an argument/claim to the visualization
  3. Audience – The audience to this visualization is not clear 
  4. Claim – There is no claim, for ex –  there has been an increase of working mothers after 1950
  5. Argument – the Visualization is not making any argument like “x” state has more working mother 
  6. Action and Prediction elements are missing, it would be a nice add on to predict number of working mothers over the next 50 years

For the above even though the visualization makes use of cool tableau features it lacks in the essential elements like Argument and prediction.

Source -https://public.tableau.com/profile/adam.davis5609#!/vizhome/WorkingMothers/WorkingMothersStateRates

Heatmap of Temperatures

In this blog I would like to analyze a heatmap of “Daily Temperatures & Precipitation” of Sacramento from 1900 to 2015. The visualization consists of 3 separate charts in different tabs for high temperatures, low temperature and precipitation.

The first thing I really liked about this chart is tabs for different charts, labeling of axis is neat and not cramped & placement of legend.

I believe this chart is a perfect example of a heatmap.Even though every daily high/low temperature and precipitation is recorded in this chart, because the author choose a heatmap it does not look cramped. We can clearly see the changes of range of temperature not only along the season but also along the different years, we can clearly observe from the High temperatures chart that the High temperatures have been consistently increasing from 1900 to 2015. The high temperatures were highest only in the months of July – August in early 1900s to June – October in early 2000s.

The one thing  I would change in the Daily High Temperatures chart as “Increasing temperature in Sacramento” . I believe that as per Tuesday’s class having a title which conveys a message/claim is better than having a description of the chart as the title.

In conclusion, I think this the heatmap is an excellent in its visualization of  a 100 years of temperature.

Source – http://digitalsplashmedia.com/sacramento-weather-data-visualization/


What Data Do I have?

I am rewriting last week’s blog entry with an example to emphasise the importance of the kind of data that can be present ( categorial, ordered, ratio) and how can it be visualized. I found the visualization which shows the Titanic Survivors. The interesting thing about this graph is that it shows the number of individuals as per different categories (dimensions) like Status (survived/perished), Sex (Male, Female), Age (Child, Adult), Class of travel (First, Second, Third, Crew).

Even though the visualization at the first glance looks chaotic I really liked the way in which the author has arranged the dimensions where by they are connected or grouped based on other dimensions. In this way we can get the exact number/percentage for example –  third class female child perished is 1%.  Similarly, if we hover on the category that gives the total numbers for example total crew 40% (885).

Another noteworthy design is the way the “mark” of the chart is separated as it flows from top  to the bottom category.
I want to conclude that the author has done an excellent work in visualizing the dataset which contains different categories.


Last Week’s Entry

For this week’s blog entry I would like to summarize the “what data”. As I am starting to work on my projects I wanted to look at the data I have collected so far.   

There are two types in which the data is stored

  1. Table Data – table data has attributes and rows. Each column/field/attribute explains what type of data is present in the row.  
  2. Metrics Data – metric data is the  has 2 or more dimensions which represent a data point.  This more useful information for analytical purpose.

Three broad kinds of data –

  1. Categorial data – the data is represented in categories, categories of the movie like humour, horror etc. We cannot do calculations solely on this data. 
  2. Ordered Data – the data is presented in terms of ranks, we can definitely say which city is better than another but we cannot  elaborate on how much it is better than the other by this kind of data.
  3. Ratio Data – This data has numbers and we can do calculations as the data is quantifiable. For example We can clearly say milage of car A is better that of car B by 6 miles/gallon.

By deciding which of the categories does my data fall under I can decide on why part of the analysis.

Top 100 Lyrics – But why?


The Visualization

The visualization  shows the lyrics of top 100 songs in a tree map. Each word has its own cell, with size proportional to the number of times the word appears. The cell is  further divided by the song.

What I don’t Like

I believe the visualization is just another pretty tree map without any claim. Also the words like ‘the’, ‘you’, ‘I’, ‘a’ etc are included and these words don’t teach/tell us anything  as against the words like ‘love’ or ‘crying’ which might give the context of what kind of emotions are felt in the song.  

What I like

Division of the words in cells and subdivision by song and highlighting of the entire song when a  word from the song is selected.

Improvements

I believe the author should have first removed all the common words by the usage of any natural language toolkit and then did the same analysis. By following this he might have had better analysis about the emotions of the top most heard songs.

I believe by taking into account each and every word there is no claim to the visualization, This is a classic example of a fancy visualization without any message.

Source – https://public.tableau.com/en-us/s/gallery/top-100-songs-all-time-lyrics


Endangered Safari – A complete guide to African animals in today’s World


The visualization aims to give a comprehensive status of large African mammals. The visualization is unprecedented in its information and the design is novel and unique.

Things I liked in the visualization –

  1. The use of animal symbols for selecting the animal.
  2. The facing of animal to emphasize decreasing or increasing population.
  3. The highlighting of the area in Africa to identify the habitat of the animal.

Things for improvement

  1. The segregation of the animals is nicely done but the animals cannot be searched by names and identifying the specific species of deer/apes based on its silhouette is difficult for an average person.  
  2. Selecting of animals based on country is not available. It would be nice to see the country names and borders as it would help an average reader.
  3. Metrics like the current numbers or the increase/decrease numbers/percentages can be added.

Although the addition of names of countries, animals, metrics like population will make it more interesting, I believe the visualization is fresh and unparalleled in showing the data about large mammals in Africa.
Resource – https://public.tableau.com/en-us/s/gallery/endangered-safari

Changing Face of America – Extraneous Background


Screen Shot 2017-01-20 at 11.35.40 PM

The above visualization shows the racial and ethnic divide of the US from 1960 to present and predicts till 2060. Though the visualization is pleasing to the eyes and looks innovative at first, I believe that the information is wrongly represented and the visualization can be improved

  1. The visualization is confusing as it appears that the states consist of the races depicted, i.e., california appears to be 100% white.
  2. The scale of the map is not consistent throughout. 85% and 64% appear to share the same area. White race has a negative slope as there is a decrease in percentage of population, similarly Black race have a negative slope even though there is an increase in percentage of population.
  3. The year 2010 seems to have almost no Asian population which is misleading. Similarly there is no “other” representation in 1960. This leaves the audience to speculate whether there are no other races in 1960 or it is left out of the map as Asians in 2010.

I think the above visualization tried to be innovative but it failed in representing the information accurately due to a map of the US in the background, a simple line/bar graph would have sufficed.

Source – http://visualnews-wp-media-prod.s3.amazonaws.com/wp-content/uploads/2015/11/06160000/1404demographics.jpg

Gay rights in the US, state by state

The visualization of gay rights in the US is definitely an exceptional work. I find that the visualization is simple, intuitive and yet one can effectively understand gay rights in different states.

Screen Shot 2017-01-15 at 3.54.14 PM


The first thing I like about the visualization is the usage of concentric circles. This is an excellent way to represent rights in individual states (along with regions) as this saves a lot of space and each state is depicted in the same chart. The placement of legend in the interior of the chart is also strategic as the traditional legend space is used for highlighting of rights of individual state as selected.

The second thing I like about the visualization is the coverage of various topics and simple representation of the “Maximum”, “Minimum”, “Prohibited”, “No law or unclear”. This visualization makes use of different colors/patterns to represent and hence does not require more than one chart to represent different states.

The chart is also not over crowded and the reader not feel overwhelmed by the information. Hence even though the information is represented in one chart, utilization of concentric circle makes the representation of gay rights across 50 states for  seven different attributes simple yet intuitive.

Source – Gay rights in the US, state by state