An Insider look in lives of famous creative people

To get out of the blues of this hectic week ( credit goes to two big submissions), I have decided to talk about something interesting. As this is the last blog, it gave me the difficult time to search for a satisfactory topic to bid farewell to this blog ritual. After hovering over two topics for a while, I decided to explore more on the daily routine of 16 famous creative people. This infographic is quite famous and got published both by FastCompany and BusinessInsider.

https://www.fastcompany.com/3028428/infographic-see-the-daily-routines-of-the-worlds-most-famous-creative-people

The infographic from “Info We Trust” is created by RJ Andrews, it talks about the daily routine of famous 16 people, round the clock divided into 6 major categories. However, these six categories are further specified precisely for each personality

Why the chart is winning:

The audience of a newsletter is always general public and Andrew’s did a superb job in attracting its Audience, Especially almost everyone can find out one or two personalities easily whom they admire their entire life.

The thoughtfulness of author wins full marks for the Aesthetics of this infographics. A pie resembling the clock and serving a good frame for the pictures is unbeatable.A brief description at the upper right of pie makes it more insightful.

The image is satisfying objective dimensions of a visualization. All the information at one place as author, title, Resources, inspired by and a tagline makes it right on point explaining all the 5W’s and how to questions.

This Viz falls in a category of visual exploration and enlightens readers actions by inspiring them with their ideal personalities. In the article, the author made a statement, “If you’re an artist, it’s a helpful guideline, especially if you feel guilty taking that midday nap. Thomas Mann and Charles Darwin certainly didn’t.”

The data for the given viz is derived from Daily Rituals: How Artists Work by Mason Currey about 161 geniuses. As I don’t have much understanding of this data, assessment of subjective dimensions of graphs is little difficult. Here is what I can conclude so far

Subjective dimensions:

Truthfulness: Data is derived from a research. I can’t say whether I can determine the truthfulness of chart but yes the visual is not making it deceptive that is for sure.

Functional: No doubt about it, The infographics is already been adored by the audience and published by two big platforms in 2014 and 2015

Beautiful: This is the most beautiful chart, I have come across till date. Although watching all of the pieces in slides is more clear but it is beautiful indeed.

Insightful: Information is insightful if you want to know about all of them without reading biographies.

Enlightening: Only if your daily routine can be changed through inspirations from super creative people. Also, if you looking out for some excuses to go to the pub and drive analogy with your favorite personality.

 
Some loopholes that can’t let this infographic win 100% score:

Missing context of data: I cannot talk about the warrant and rebuttal of this claim as there are no documentation and data sources cited. In lack of which I am not able to confirm the right choice of visualization.

Inconsistent Overview: Divided categories are again described for each piece of information which is not even readable in full form. Here it fails to provide an overview to the audience. Moreover, it makes it confusing. Apart from sleeping no activity is similar among two people than representing each in all of these pieces at the same place doesn’t make sense to me.

No compare and contrast ease: As the discrete information is serving a purpose of a frame and clock but failing in comparing and contrasting activities of two people. For people like me, visualization is the best tool to directly comment on the differences.

As we say eyes beats the memory, this infographic will serve more as a gallery than a visualization. If I will go and check out the whole info in 21 slides I would rather not dare to find out any insights or comparison. This would be too much time to spent on this infographic.This Visualization is the perfect example of Aesthetic before the objective or validation of claim.

If I were to redesign this visualization:

-> Certainly, I like the pictures but if it is converting a viz into a gallery, I would certainly not choose that.

-> A simple representation and a tooltip feature to not flood my viz with over information will be my choice.

-> These are a lot of pies, which might illusion the redundancy for my audience, Hence choosing a bar graph could make me happier. Save the space to soothe your eyes!

I have found a better visualization for the above infographic. Data and research resources are similar:

https://podio.com/site/creative-routines

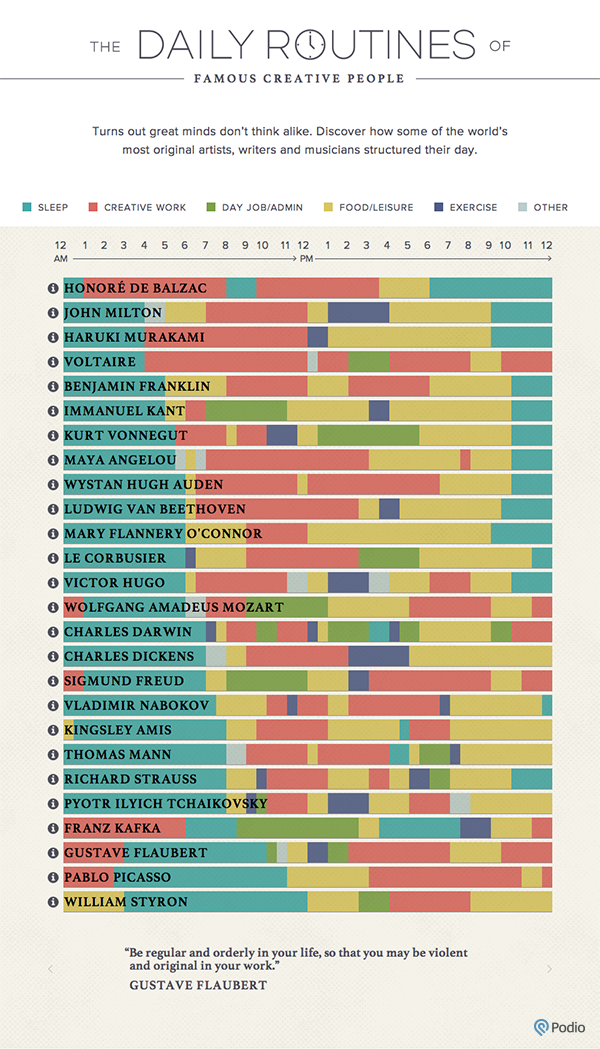
A simple beautiful improved and interactive viz, which also flashes the famous quotes by these big personalities, along with a disclaimer.

Clean representation of all six categories and no over flooding in an overview of this information. A tool tip shows the insider information without distorting the main purpose of consistency in visualization.

A clock on X- axis: Some numbers are good and we don’t want resemblance mostly in the clock. The reason I prefer a numbered dial over a blank dial with fancy figures.

Better color-coding: Removing white color seems a very intelligent stroke just that I didn’t like the red for primary work either( green was better). but might be for him sleep is the most constructive activity for creative brains 😉

Compare and Contrast: Now it is serving a purpose of visualization, let me quickly find out who two are similar or extreme opposites.

Efficient use of space: The focus is not diverted and you can see everything without putting the strain on your eyes. Bravo to the Author for a perfect visual problem-solving !! 🙂


References:

https://podio.com/site/creative-routines

http://www.businessinsider.com/daily-rituals-of-16-famous-creatives-2015-1/#ch-day-was-mapped-out-onto-a-24-hour-cycle-1

https://blog.miproconsulting.com/category/nerdery/

https://www.fastcompany.com/3028428/infographic-see-the-daily-routines-of-the-worlds-most-famous-creative-people

What Murder Says About the Society It Exists In

Homicide refers to the unlawful killing of one person by another. It is vicious and impacts our life severely. So many organizations and volunteers are supporting the cause “Calling for peace” but on a broader note, is it important to get into the stats and analyze these numbers? Certainly, if someone is looking for relocation in countries other than their home country, yes! this is a big concern. While hunting for visualization this chart from our world in data caught my attention:

https://ourworldindata.org/homicides/

Homicide rates in five Western European regions, 1300-20102 : This chart is created by Max Roser talking about homicide rate in five Western European regions for a time period between 1300 to 2000. The data is derived from a study of UNODC(United Nation Office on Drugs and Crime) and Eisner(2003). The author represents that European homicide rates have dramatically decreased over the last millennium and have remained steadily low over the past 50 years.

Why is this chart winsome?

The only good point, I found about this chart is that it is interactive and it is real fun and easy to use interactive charts. The bullets all over the chart are showing exact numbers and year for respective countries. As we know that numbers are insightful, it certainly wins some points for the author and his efforts.

An additional point which I will leverage to the author is the illusion of simplification through the visualization. If you will look at the data source, it is very messy and certainly, he cleaned this data up to a great limit to represent five regions.

Overview of Analysis on the Visualization:

Domain: Data source of the chart includes many countries and region but for this particular visualization author has chosen Five western European regions though there is no explanation given as to what is the specific reason behind this selection. Hence I would say that domain seems little dubious in presenting why and how questions.

Audience: This visualization is available under Violence and rights category so I can assume that the visualization is made for general public and who so ever is concerned with this particular information. Moreover, it could be anyone who wants to find out that which place is safe to live if they are considering relocation.

Claim: This chart justifies the claim that the rates of homicide are dramatically decreasing which is a good sign. Though whether the claim is derived accurately becomes an ambiguous spot if you will look at the data source. Below is the part of data set representing statics for all the countries over the years:

http://www.unodc.org/gsh/en/data.html

Loopholes in the warrant of this Visualization:

Author calculated an average of all countries for the region more than one country but there is no justification provided for choosing specific countries.How come an average of two countries can be accountable for the whole region without representing the real difference among them.

Timeline of the visualization: In the given chart Scandinavia has no data for 1300 from where the chart is starting and there is no data available for Italy after 1300 and before 1550. This makes it very inconsistent approach.

Even the numbers are doubtful. Looking at the original data source and derived data sheet, numbers seems questionable.

The chart claims comparison among western countries though accounting Italy which is in Southern Europe and England from Northern Europe arise so many questions on the integrity of data.

Rebuttal: The author seems least bothered about the missing data which could be a potential rebuttal. Another rebuttal here is the unidentified base of numbers. Real data talks about count and rate and which is not comparable with other countries. To crosscheck the fact, look at the data source. Even if the rate is lesser the count is greater than another country whose actual count is lesser but the rate is higher. This needs a proper justification!

Backing: The backing of the data fails severely here and there is no documentation available to clarify a little bit about the claim and its warrant. This makes this visualization deceptive which poorly fails to reach its goal. Hence on the properties of a good visualization, the chart holds as below:

1. Truthful – No, but deceptive 100% 🙁
2. Functional – 100%  at least for what is claims 🙂
3. Beautiful – 70% (as it is so clean and colorful) 😐
4. Insightful – 50% only if you don’t do any analysis otherwise 0% 🙁
5. Enlightening – 20% only if you don’t care 🙁

Additional Disappointments about the appearance of this chart:

Even if a forget about integrity and faulty derivation of data plotting a line chart is not a good choice. These numbers are attractive and they should actually plot it through horizontal bars representing real numbers for each country. Overlapping of bullets for the later years doesn’t look good and clean as well.

What could have been a worse visualization for this situation:

For such sensitive topic a visualization that talks about nothing, a complete disappointment from EDGE organization

If I were to redesign this visualization:

Considering above information, I decided to redesign this chart but when I tried to relate the information with this chart, it became so cumbersome. The reason is over simplification of information. It raises the need of an optimal cleansing of data in order to guard against information tailoring. Due to lack of dataset for the given timeframe, I cannot recreate this visualization but I would certainly try to include below points to make my chart Insightful for the audience who wants to grasp the reality and trying to make a decision (example- relocation) out of it.

1. A bar graph for the easier comparison among countries over years keeping years of y-axis and number of homicides at the x-axis. I will choose a color differentiation for including an average scale to differentiate among bars that are more than average for respective countries.

2. I will display exact numbers for each country rather aggregating them because there is no base which subsides the real reason of not differentiating among countries.

3. A proper color coding is required for easier recognition and probably green for lower than average and red for greater than average would be a good choice.

A similar graph on this situation is a better choice from Dailymail UK news:


The graph clearly shows the numbers of countries accountable and could be a better choice to have a perception over peace index of countries:

What is the most enlightening visualization for above situation:

Another chart from Daily mail UK helps people to decide whether to which country is considered safer by showing exact numbers. A decrease or increase in crime tells a lot about the situation and can help one to reach to their decision.

References:

http://www.dailymail.co.uk/news/article-2313942/UK-Peace-Index-Rate-murders-violent-crime-falling-faster-Western-Europe.html https://www.edge.org/conversation/steven_pinker-a-history-of-violence-edge-master-class-2011 http://www.unodc.org/gsh/en/data.html

Did you ever know this?

After writing my first blog and having discussions over Visualization for 4 weeks, I can certainly see a change of perception towards Data/Information. This deep thinking invoked me to search for many numbers of charts/reports/visualizations available all over the internet.What I exactly wanted to achieve is to find something with the help of which I can understand all the terminologies/principles/ properties and recommendations we learned from Professor Schermann. As I am always very much excited to know about new things or may be unexplored facts, this report became my end of the search and I am sure that many of you would be wondering that which country is at the top for what. So, here you go!!

http://www.informationisbeautiful.net/visualizations/because-every-country-is-the-best-at-something/

This chart is research of David McCandless along with Stephanie Smith and Esther Kersley. The original version of the research came out in 2009 which is also available on the link above. The data from which the research is derived is also attached and the spreadsheet shows all underlying information.

The author claims to represent all the countries and what they are best at. They all are divided into 9 categories altogether which includes commodity, psychology, ecology, gastronomy, economy, Nicety, humanity, technology, nasty. It makes this chart interesting enough to immediately connect with the audience. for example, I suddenly wanted to check out category humanity, especially for female entrepreneurs and Zambia won my heart. The backbone of the report is its documentation attached. We have discussed that validation is very important and documentation is something which gives us the base to rely on information. Below are some terms which we discussed in class and could be easily understood with this chart.

1. Claim: According to data, every country is the best at something. This claim is derived mostly from the data available for top ten countries in *.

https://docs.google.com/spreadsheets/d/11uifsxtHKwRysrxNxTDhvWLDHTlxQ0jYP8PODoLM2hM/edit#gid=1130095511

2. Warrant:  It is the relation you derive from data to explain your claim. Example- Australia is at the top in the world of cyber security incident and report comes from Pwc which compares the number of such incidents among countries and Australia has 9,434(highest) such incidents in comparison to other countries.

http://www.pwc.com.au/press-room/2015/cyber-security-risks-oct15.html

3. Backing: Backing supports your warrant and to validate this point I went on checking some news published on the report. An insight to all of us could be that Croatia is number one in kidney transplant the same was verified by NCBI. There is a sufficient growth in organ transplant that supports the argument.

https://www.ncbi.nlm.nih.gov/pmc/articles/PMC3610255/

4. Rebuttal: It is that counter indication which makes the claim dubious. A rebuttal here can be seen from an example of Child Bride which is claimed to be the highest in  Niger. There are six countries that do not specify a minimum age for marriage and it could possibly impact this claim. There might be no data available for these countries in this regard.

https://www.weforum.org/agenda/2016/09/these-are-the-countries-where-child-marriage-is-legal/

5.Where the claim qualifies: David reveals all of his data sources and accepted that for some countries there is no data available. Hence the claim qualifies only for participant countries and for all of these nine categories. Anything beyond which they cover could be another surprise.

Though the chart is not explaining the facts but it is very insightful. It might be very enlightening for commodity business because now they can know which country sells the cheapest Nike and Botswana is the best place to get Diamonds from. Otherwise, my wild guess would definitely be China for Diamonds. This chart is truthful as most of the facts include the information for those derivations. For example of validation, World Atlas also claims that worst country for child labor is Eritrea.

http://www.worldatlas.com/articles/worst-countries-for-child-labor.html

The last and the most crucial part is to understand the domain. Context is such powerful tool that it could turn things around. A good example is this chart showing Singapore at the top for having healthiest people. Data is driven from Bloomberg rankings and ranking is based on factors like birth, mortality rates and cause of deaths. Whereas USA today claims the same but differs in its listing putting Qatar at the top. The debate is not for who is right instead of context because 24/7 Wall St’s ranking is based on factors widely categorized as health indicators, access measures, or the economy. Here you see how the context can bring out a different picture, so be aware of your domain while claiming!

References:

https://www.usatoday.com/story/money/2015/04/03/24-7-wall-st-healthiest-countries/70859728/

and all of the hyperlinks above.

Behavioral analysis of social networking users

Since data visualization is a powerful tool and we all like to see our curiosities about some topics into a visual reality. I wanted to explore data available on social media. Social media has proved itself very influential in one’s life, politics, entertainment, media, economy, terrorism, e.t.c. While exploring on some interesting charts, this one caught my eye as it looked very beautiful to me and instantly because of these vibrant color, I was able to relate it to Social Networking because it totally illusion a so-called “COOL” factor. But think of these marketing managers who are striving hard to beat their competitive companies and cutting out budgets for deciding an appropriate campaign for such big industry.

http://visual.ly/global-map-social-networking-2011

About the chart:

This chart on visually is actually showing results from analysis of behavioral data which was gathered through some detailed questions to differentiate among users basis on how they use Social Networking. This dashboard is published by Global web index who collected number(millions) of active social networkers from all markets(Countries worldwide) and segmented them into three categories. It differentiates users on how they use social media among 3 categories below:

1. Messages and mailers
2. Content Sharers
3. Joiners and creators of groups

The chart shows a global map of social media usage in 2011, which could help marketing managers to make strategies accordingly for different markets as the each market has users who use it differently, Author quotes an example of established markets US/UK whose users are more focused on messages instead of content sharing unlike growing markets like Indonesia/China whose users are more focused on content sharing and groups.

Why the chart is winsome:

1. A very important feature of this chart is its objective, which is fully justified from the dashboard. The designer has tried to fully justify the need for a marketing manager. Moreover, the use of a world map gives a whole view of the solution and here I mean by this additional bar chart showing global social network penetration. This bar chart enables us to easily figure out the potential of active users in each country and we can simply locate the target.

2. This Dashboard is beautiful to my eyes as it is not very clumsy and complex to understand. In addition to it, the author has used good colors to catch audience eyes. Use of horizontal bars to compare three categories is also very visionary as this makes the comparison easier.

3. However, the chart is not explaining the reason of how this is affected but it could be easily used as the prescription to figure out the potential of users.The chart enlightens me on how the usage could be differed and can make an impact as most of us use social networking regardless of thinking what exactly we are using or how we are using it.

Why the chart is off-putting:

1. As my first impression of the chart was a beautiful world map, I instantly assume that the circles representing each country are located on their actual location. However, this is deceptive here!
India, HongKong, France e.t.c. are not at their place which arises a question on the need of a world map chart.

2. Even the size of the circles is misleading, I presumed that the circle size is related to the market establishment/market size but it is the number of active users which made me feel that this information is presented redundantly. There is no information which can talk or compare the market establishment as the author mentioned in his statement.

What do I want to change in this chart:

1. I feel that circles must represent the market establishment (e.g. for US/UK) so that the audience can potentially mark the growing markets which are a very important metrics for marketing people.

2. Also, I would prefer a bar chart showing countries on Y axis with three horizontal bars comparable among each other and also with other countries. For example, a direct comparison among mailers category between China and Malaysia would be easier that way.

3. Although, we just started the course in the dashboard but I would like to have interactive charts for such cases which could be more insightful and could use filters to focus on certain metrics separately to catch more attention from audiences.

References:

http://visual.ly/global-map-social-networking-2011