I personally have never used a box plot because I didn’t know how to use it and when to use it. But when Professor explained in last lecture about average violations per day using box plot, I found it more appealing. Box plots are great way to quickly examine one or more datasets graphically. Of course, you need to know the meaning of all fields on a box plot to understand it. Here is an easy and simple example of how to interpret a box plot.

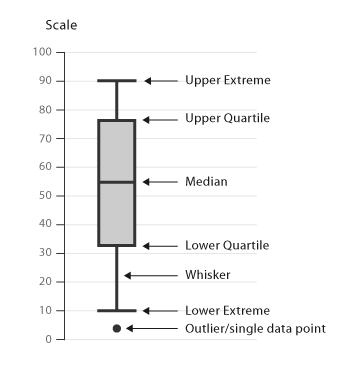
- Box plot (aka Box and Whisker Plot) plots all data points and splits it into quartiles (Q1, Q2, Q3) and it is represented as a box which goes from first quartile to third quartile.
- The vertical line drawn at the Q2 is median of data set.
- Two horizontal lines extend from front and back of the box are called whiskers. Whiskers often (but not always) stretch over a wider range of scores than the middle quartile groups.
- The extreme points preceding first quartile and following third quartile are known as outliers.
We can display three common measures of the distribution in data set.
- Range: It is the distance between two extreme points on a plot. If we consider outliers, then it is between (5) to (95)-> 90. If we exclude outliers, then it is (95-15) 80.
- Interquartile range: The middle half of a data set falls within the interquartile range. In a boxplot, the interquartile range is represented by the width of the box (Q3 minus Q1). In the chart above, the interquartile range is (80-38) 42.
- Skewness: We can identify different skewness patterns based on shape of dataset. If the data points are concentrated at the lower end, the distribution is skewed right and vice-versa. If it is evenly split at the median then it is Symmetric.
In Speed Violations example, we can easily identify danger zones which are nothing but those outliers in box plot. Also, our grades distribution on Camino is also a box plot which gives you where your grades stand in overall class grades, what is the average score and how many are above/below average.
I am trying to create a box plot in Tableau, if anybody has already done please share!
Source: http://www.datavizcatalogue.com/methods/images/anatomy/box_plot.png
http://stattrek.com/statistics/charts/boxplot.aspx