Being the fifth largest country in the world in terms of land area and the third largest in terms of population, it is not surprising to find the USA in the second position in terms of percentage consumption of energy(19.2% of the total world consumption). This figure can be reconciled with another recently acquired data: a dramatic climb in urbanization(more than 80% as of 2015) resulting in a commensurate rise in ‘megaregions’ – Cities which either have/are projected to have a population of 57-63 million by 2025. Consequently, the energy required is derived from a wide range of ‘primary sources’.
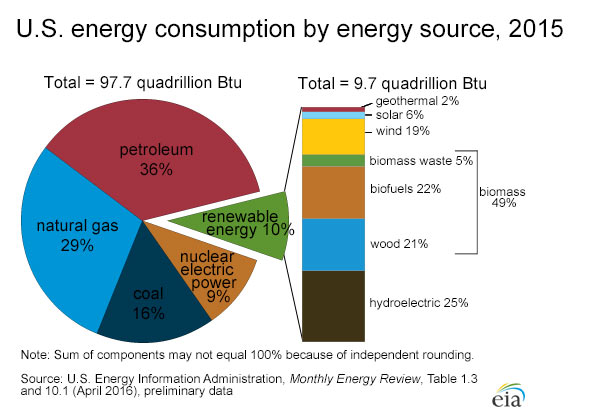
The pie-chart above provides a bird’s eye view of the distribution of the sources of energy. The chart is pretty straightforward and serves its purpose with aplomb – Even a perfunctory glance enables the viewer to grasp the percentage distribution of energy sources, both renewable and nonrenewable. But things get more interesting(or irksome, depending on the way one sees it) when the association between the energy sources and percentage utilization too is incorporated into the same representation. Here, have a look.
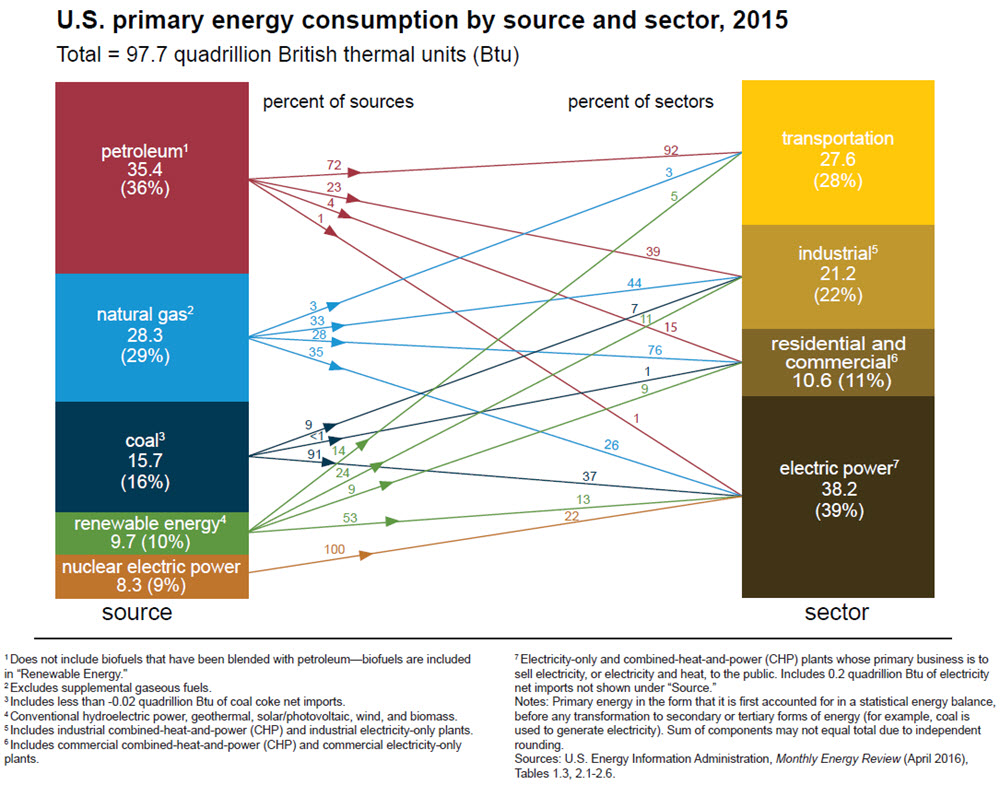
This representation shows (almost) everything depicted in the initial representation and much more. The difference between the two is stark as a cursory glance is much more likely to confound the viewer than to provide them with an idea about the energy distribution. But upon careful comprehension in a systematic manner, it becomes apparent that the second representation is packed with more information as it depicts not just the source of energy and the sector where it is used, but also the percentage of energy source used and the percentage of energy generated in the corresponding sector. For example, 72% of petroleum(which provides 36% of the total energy) provides 92% of the energy required for transportation(which as a whole uses 28% of the total energy).
The representation above epitomizes the adage ‘A picture is worth a thousand words’. Once the viewer grasps the key required to unravel the huge amount of data depicted in the representation, it provides him/her with everything he/she needs to know about energy sources and its utilization.
Source – http://www.eia.gov/energyexplained/?page=us_energy_home
Interesting post. As you rightly mentioned, the first visualization provides an overall picture. Though the second visualization appears little complex, it is apt for someone who wants more than just the overview.