To get out of the blues of this hectic week ( credit goes to two big submissions), I have decided to talk about something interesting. As this is the last blog, it gave me the difficult time to search for a satisfactory topic to bid farewell to this blog ritual. After hovering over two topics for a while, I decided to explore more on the daily routine of 16 famous creative people. This infographic is quite famous and got published both by FastCompany and BusinessInsider.

The infographic from “Info We Trust” is created by RJ Andrews, it talks about the daily routine of famous 16 people, round the clock divided into 6 major categories. However, these six categories are further specified precisely for each personality
Why the chart is winning:
The audience of a newsletter is always general public and Andrew’s did a superb job in attracting its Audience, Especially almost everyone can find out one or two personalities easily whom they admire their entire life.
The thoughtfulness of author wins full marks for the Aesthetics of this infographics. A pie resembling the clock and serving a good frame for the pictures is unbeatable.A brief description at the upper right of pie makes it more insightful.
The image is satisfying objective dimensions of a visualization. All the information at one place as author, title, Resources, inspired by and a tagline makes it right on point explaining all the 5W’s and how to questions.
This Viz falls in a category of visual exploration and enlightens readers actions by inspiring them with their ideal personalities. In the article, the author made a statement, “If you’re an artist, it’s a helpful guideline, especially if you feel guilty taking that midday nap. Thomas Mann and Charles Darwin certainly didn’t.”
The data for the given viz is derived from Daily Rituals: How Artists Work by Mason Currey about 161 geniuses. As I don’t have much understanding of this data, assessment of subjective dimensions of graphs is little difficult. Here is what I can conclude so far
Subjective dimensions:
Truthfulness: Data is derived from a research. I can’t say whether I can determine the truthfulness of chart but yes the visual is not making it deceptive that is for sure.
Functional: No doubt about it, The infographics is already been adored by the audience and published by two big platforms in 2014 and 2015
Beautiful: This is the most beautiful chart, I have come across till date. Although watching all of the pieces in slides is more clear but it is beautiful indeed.
Insightful: Information is insightful if you want to know about all of them without reading biographies.
Enlightening: Only if your daily routine can be changed through inspirations from super creative people. Also, if you looking out for some excuses to go to the pub and drive analogy with your favorite personality.
Some loopholes that can’t let this infographic win 100% score:
Missing context of data: I cannot talk about the warrant and rebuttal of this claim as there are no documentation and data sources cited. In lack of which I am not able to confirm the right choice of visualization.
Inconsistent Overview: Divided categories are again described for each piece of information which is not even readable in full form. Here it fails to provide an overview to the audience. Moreover, it makes it confusing. Apart from sleeping no activity is similar among two people than representing each in all of these pieces at the same place doesn’t make sense to me.
No compare and contrast ease: As the discrete information is serving a purpose of a frame and clock but failing in comparing and contrasting activities of two people. For people like me, visualization is the best tool to directly comment on the differences.
As we say eyes beats the memory, this infographic will serve more as a gallery than a visualization. If I will go and check out the whole info in 21 slides I would rather not dare to find out any insights or comparison. This would be too much time to spent on this infographic.This Visualization is the perfect example of Aesthetic before the objective or validation of claim.
If I were to redesign this visualization:
-> Certainly, I like the pictures but if it is converting a viz into a gallery, I would certainly not choose that.
-> A simple representation and a tooltip feature to not flood my viz with over information will be my choice.
-> These are a lot of pies, which might illusion the redundancy for my audience, Hence choosing a bar graph could make me happier. Save the space to soothe your eyes!
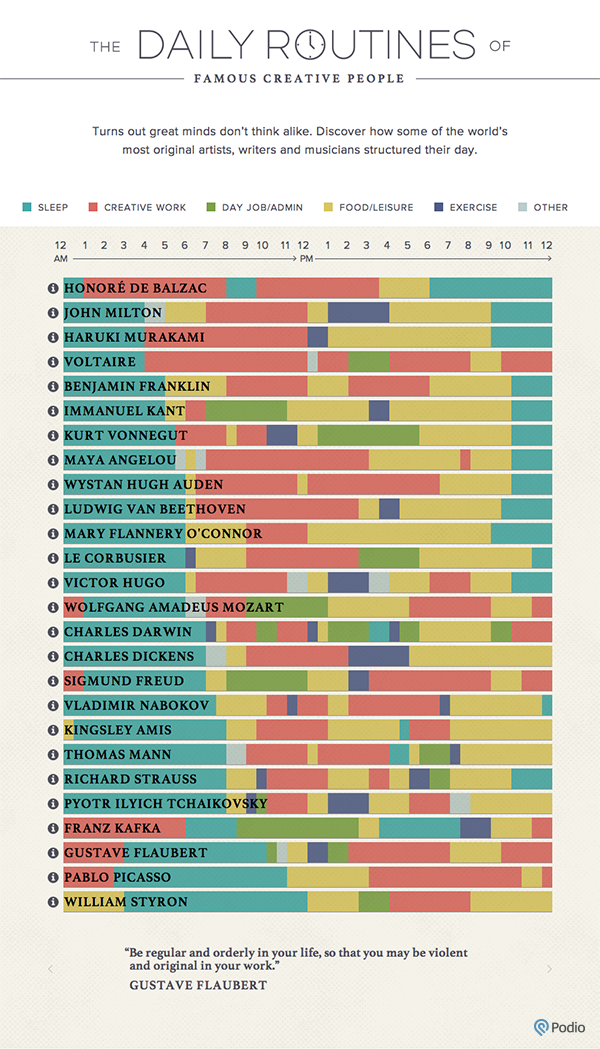
I have found a better visualization for the above infographic. Data and research resources are similar:
https://podio.com/site/creative-routines

A simple beautiful improved and interactive viz, which also flashes the famous quotes by these big personalities, along with a disclaimer.
Clean representation of all six categories and no over flooding in an overview of this information. A tool tip shows the insider information without distorting the main purpose of consistency in visualization.
A clock on X- axis: Some numbers are good and we don’t want resemblance mostly in the clock. The reason I prefer a numbered dial over a blank dial with fancy figures.
Better color-coding: Removing white color seems a very intelligent stroke just that I didn’t like the red for primary work either( green was better). but might be for him sleep is the most constructive activity for creative brains 😉
Compare and Contrast: Now it is serving a purpose of visualization, let me quickly find out who two are similar or extreme opposites.
Efficient use of space: The focus is not diverted and you can see everything without putting the strain on your eyes. Bravo to the Author for a perfect visual problem-solving !! 🙂
References:
https://podio.com/site/creative-routines