Google Analytics is a free web Analytics service that provides statistics and basic analytical tools for search engine optimization and marketing purposes. Its main features are Segmentation for Analysis of datasets like transformations and conversions, Data Visualization tools like dashboards and Scorecards, custom reports and communication through email-based sharing. It’s integration with other Google products like Adwords, Public Data Explorer, and Website Optimizer makes it very suitable for small and medium sized retail websites.
Google Analytics dashboard allows users to save profiles for multiple websites and see details for default categories or select custom metrics to display for each site. One of its advantages is that it is available through a plugin or widget for embedding into other sites. 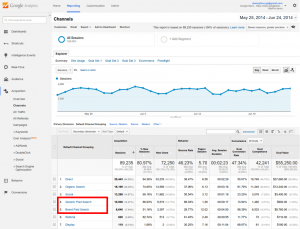
There are many practices that are followed in Google Analytics that should be followed while creating a dashboard and are particularly helpful in Tableau:
- Use a maximum of 12 dashboard objects or widgets so that designers and analysts are able to focus on the relevant KPIs and pertain to the Story of the Dashboard. “Keep it Simple.” “Less is more.”
- Improve User experience by leveraging Dashboard actions like highlighting sparklines to display underlying trends and show extra detail for respective data points.
- Allow End users to change the Date aggregation of Line Graphs: Hourly, Day, Week, Month.
- Keep Crosstabs width to a maximum of Ten Columns.
- Use a vertical navigation in the left column to display the prioritized content to the top-left view of the dashboard.
Source: http://www.evolytics.com/blog/10-tableau-data-viz-tips-i-learned-from-google-analytics/