Data driven decisions at Walmart is more like a norm than a exception. WalmartLabs analyzes the data from the social network sites through their tweets, pins, shares, comments and so on to get retail related insights.
In an age where sharing of information has been made easy, social media is paying a vital role in creating better understanding of consumer likes through social buzz. Such social buzz typically precedes all important product launches. People are frequently expressing their views about the latest smartphone or the coolest video game to be hitting the shelf. WalmartLabs taps this social buzz and helps buyers plan their inventory and assortment.
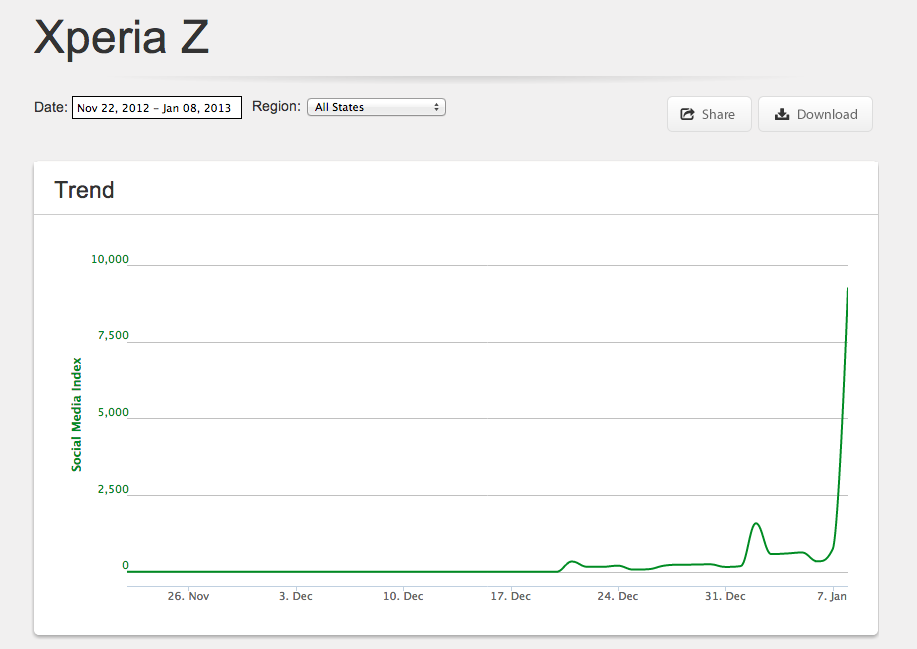
Consider the following visualization of Sony’s Android phone Xperia Z showing a spike in social activity that helps its buyers to make smarter decision ahead of time. Walmart’s buyers also get a sense of what they should stock online and in stores by checking out pins on Pinterest. Top pins feed into a social-media analytics dashboard for buyers. So do the reports from Twitter that engineers have created by visualizing and analyzing Twitter feeds. Buyers can see when the number of tweets on, say, gel nail polish peaked and see which colors were the most popular in which locations.
Such humongous amounts of social data are generated online, and it is crucial for retailers to transform it into meaningful information. These insights is what enables the buyers to understand the customer demands and plan their inventory accordingly.
Source: http://www.fusioncharts.com/whitepapers/downloads/Towards-Effective-Decision-Making-Through-Data-Visualization-Six-World-Class-Enterprises-Show-The-Way.pdf