This week I watched an old movie about Florence Nightingale. It was a really great movie, and I was blew away by how great Florence Nightingale is. She is best known as the lady of the lamp, the founder of modern nursing who cared for thousands of soldiers in appalling conditions during the Crimean war.
Later on, I found out that Florence Nightingale was also a superb statistician. In 1857, she created a revolutionary a controversial diagram, called rose diagram. It forced the British government to create better and cleaner hospitals.
This is the Nightingale Rose chart.
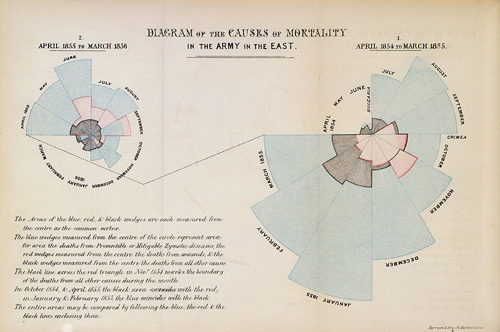
The charts illustrate from 1854-1856, the solder’s death in each month according to the cause of the death using different colored “rose petals”.
The message that the diagram delivered was potent and direct – hospitals can kill. It’s also fascinating that the diagram revealed that if the right improvement were made those mass deaths in the hospital could be avoided.
There are 4 benefits of Nightingale Rose chart : 1) The color is very eye catching, and the audience is willing to read more at the first sight 2) Each slice takes an equal sector of the circle, making labeling much cleaner; 3) Each slice still maintains an accurate area comparison with other slices (by making the radius of the slice equal to the square root of the value); and 4) Nightingale also put another contrasting rose chart to show that the death could be avoid with the right improvement.
Nightingale was the first to use a statistical graphic as a call to action. The diagram convinced the public that the epidemic disease could be controlled and that is the purpose of the graph. And force the British government to spend money on the sanitation.
This is exactly what we are trying to achieve in our data visualization class. The purpose of a diagram is trying to make a claim and creating value.
The Nightingale Rose chart illustrates that how powerful can a good visualization be. But it also occurred to me that the larger blue “rose petal”could be miss leading. We cannot “cherry picking”on how we present the data. Representing raw data visually should reveal, not conceal.
Reference:
https://www.pinterest.com/pin/128704501821544284/
- Did Nightingale’s ‘Rose Diagram’ save millions of lives?
http://www.florence-nightingale-avenging-angel.co.uk/?p=462
- Florence Nightingale — História da Enfermagem — O filme completo
https://www.youtube.com/watch?v=sYZnzt0CJtE