A pie chart is one of the inefficient ways of communicating data to the audience. Generally speaking, pie charts can be used to show how one part is related to the whole, however they are often misleading, and inaccurate. Let us evaluate such a chart.
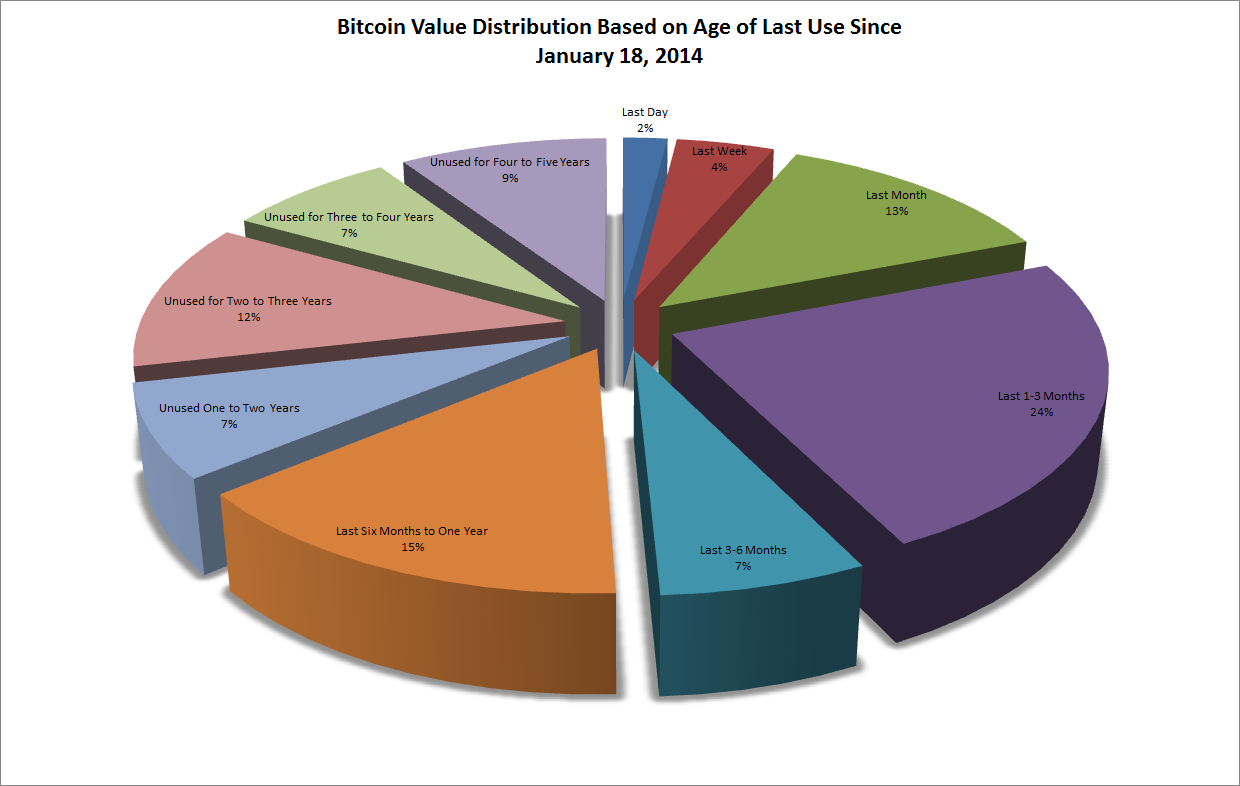
The above chart conveys an idea about the total percentage of active and inactive bitcoin addresses. About 65% of all bitcoins in existence are associated with an addresses that had some activity within the past year and have been categorized into separate group as per their last usage. This data is quite interesting and relevant to the hot electronic payment system domain, however the visualization violates several aspect of good design and unable to make an effective communication. Below are the details of my evaluation and I will conclude by providing an ideal chart for this data.
Point 1: There are multiple(10) categories in the pie, and I found it difficult to identify the proportions correctly and compare across these categories. Now one might argue that these portions have been labelled by the values of each slice, but we are forced to look across different sections to make any comparison. The text levels are also small and overly complex.
Point 2: Making the chart in 3D is like adding insult to injury. Humans are bad at judging relative sizes and adding a 3rd dimension makes it almost impossible. I found the section near to me(my screen) “Last six months to one year”(15%) to be the biggest. However the “Last 1-3 months” section has a bigger value(24%).

Point 3: Color and Aesthetics are not good. The choice of color is very amateurish, and gives no real relation to each other. Also pie chart’s circular structure use up too much space while not allowing their labels to line up. The time scales of each slice are completely different which confuses the audience more.
How would I change it:
A plain and simple representation of data is the most effective way of communication. We tend to over-engineer a chart which changes the essence of the information that needs to be communicated.
A table can be used instead to communicate the information. Even a bar graph is a useful tool for this data set. When we want to compare two things, in this case the use of bitcoin address, we typically should put those two categories as close together as possible and align them along a common baseline to make this comparison easy. A bar graph can help us do this comparison easily because our eyes compare the end points and it’s very easy to assess relative size.
The look and the feel of the dashboard can be modified by changing the font and simplifying the text label. The text label should not be very long. Regarding the color scheme, ideally a darker color creates more impact. Both the 24% and the 2% section in the pie chart have darker shades, which doesn’t adheres to the selection of the best color scheme. So instead of multiple colors, a single color of varying hue should be used.
References:
http://www.dashboardinsight.com/articles/digital-dashboards/building-dashboards/the-case-against-3d-charts-in-dashboards.aspx