Finding the Right Color Palettes for Data Visualizations

In this blog, three rules of thumbs have been provided:

  1. Have a wide range in both hue and brightness

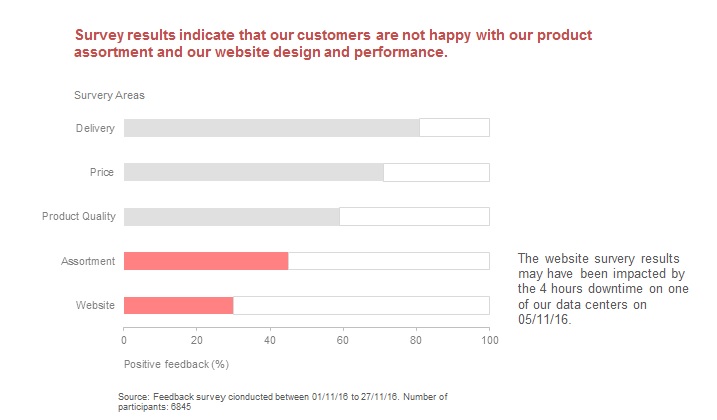
To have palettes which are varied in brightness, so that the audience can distinguish the information easily. If you use bright color or hue color only, people who are color blind will have difficulties cannot be able to tell the difference, and those ordinary audiences will also be suffered from

2.   Follow natural patterns of color

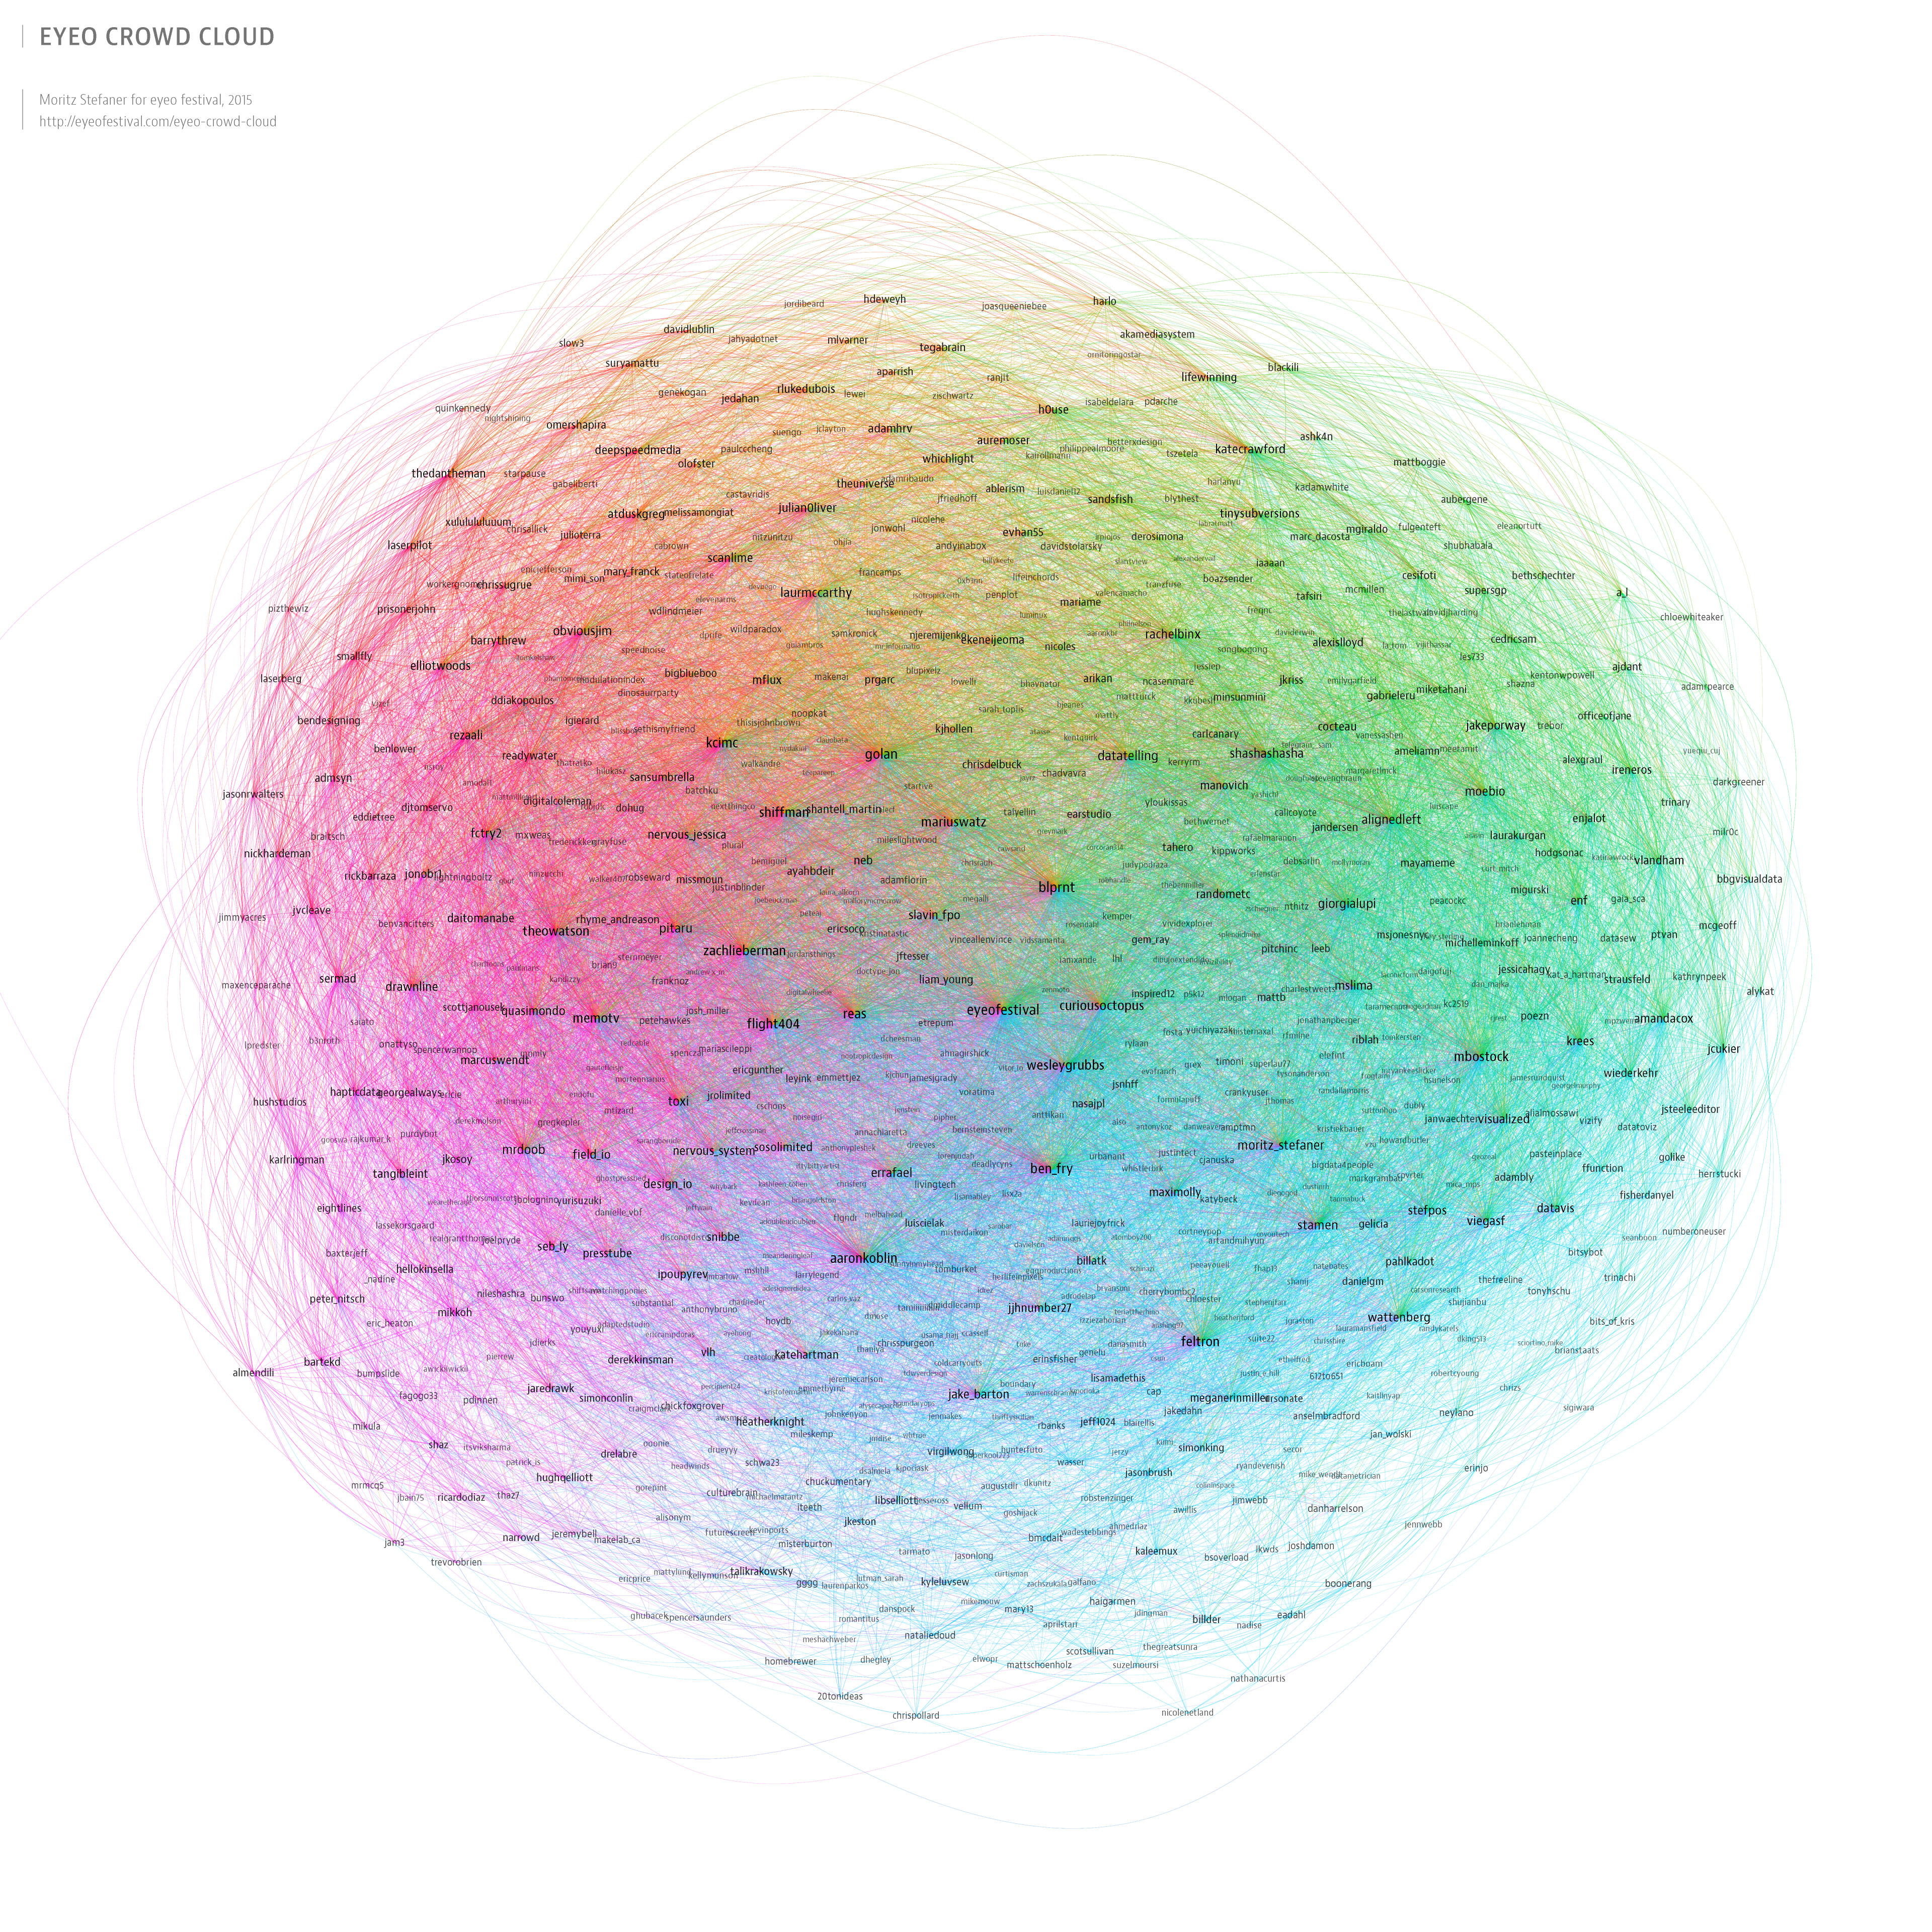
Sometimes nature can give you the most inspiring instinct. if you look at the landscape below, a sunset or the spring in a forest, you will see the beauty of palette of a light green to a purplish blue or an orange-brown to cold gray…that color makes you fell pleasant when you see natural view will give you similar feeling when you design your own visualization work.

3.  Use a gradient instead of choosing a static set of colors

To extract from the gradients will make your color seems more natural and pleasing. By use of grayscale and grid, designers will be able to switch color by descending hue easily.

Finally, here are some useful links for you guys to make as references when choosing your color palette.

Tools

Color Picker for Data — a handy color tool where you can hold chroma constant and pick your palette with ease

Chroma.js — a JavaScript library for dealing with colors

Colorbrewer2 — a great tool for finding heat map and data visualization colors, with multi-hue and single-hue palettes built in.

gradStop.js — a JavaScript library to generate monotone color schemes and equidistant gradient stops

Color Oracle — a free color blindness simulator for Window, Mac and Linux.

Other Resources

And here are some other good color palette resources we found and loved. While they are not necessarily designed for data visualization, we think you would find them useful.

ColorHunt — high quality color palettes with quick preview feature, great resource if you only need four colors

COLOURlovers — great color community with various tools to create color palettes as well as pattern designs

ColorSchemer Studio — powerful desktop color pick app

Coolors — light weight random color palette generator where you can lock the colors you want and swap out the others

Flat UI Colors — great UI color set, one of the most popular ones

Material Design Colors — another great UI palette. Not only does it provide a wide range of colors, it also provides different “weights” or brightness of each color

Palettab — a Chrome extension that shows you a new color palette and font inspiration with every tab

Swiss Style Color Picker — another collection of good color palettes

reference:

https://blog.graphiq.com/finding-the-right-color-palettes-for-data-visualizations-fcd4e707a283#.iumxfns41

Interactivity in Tableau (continued)

This week we will take a look at sets and groups feature in Tableau. Let’s start with sets –

Sets are user defined fields which help in viewing a subset of the entire data. We can create sets on dimensions using conditions or specific data points. It is interesting to note that whenever the underlying data changes, sets are recomputed based on whether they are constant sets or compute sets. Seems quite similar to filters, isn’t it? Yes, a lot of the functionality is same, such as dynamically obtaining a subset of the data and the ability to be applied across the workbook. However, the differentiating point is that sets can be used in other calculated fields. This is particularly useful, when creating a subset of the data, using a set or filter, is just the starting point of your analysis. Let’s take a look at how we can create sets:

  • Constant sets: This option is similar to that of the Keep Only/Exclude option while creating filters. Using this option, the user can select the data points which he/she is interested in and then keep those only in the visualization for further analysis. The important point here is that once created, the data points in the set do not change dynamically. This can be achieved by selecting the data points in the visualization and selecting the Create Set option in the Tableau prompt. There is also an option to perform a negation operator by selecting the “Exclude” option in the following prompt. For our speed violation data set, if we have a map of violations in the map for Chicago with the addresses marked as per violations reported, the user can create sets based on areas of interest or select the top three violations and just focus on those.
  • Compute sets: Using this option, the user can create sets which dynamically change when the underlying data changes. To create such a set the user can select a dimension and select the create option. There are three options to create sets – general, condition, and top. The general tab allows the user to view the entire list of data and choose from it. The condition tab allows the user to create a condition based on which the set will create the subset of the data. The third tab, known as “Top”, is probably the most used for numerical analysis. This tab has options for the user to perform Top N or Bottom N analysis. For our example data set, we can use a set to create a Top N analysis of addresses with the highest number of violations. This can be extended further by making the “N” value as a parameter, allowing the user to specify how many addresses he/she wishes to see in the “Top List”.

As a final point on sets, it is important to mention the IN/OUT option which helps the user switch between the subset and the rest of the data.

Groups are similar to a set and help to organize the data better in a visualization. They help to create hierarchy within dimensions, thereby helping the user organize the data items within a dimension. We can create a group by manually selecting the data items in the visualization and then choosing the Group icon which comes up in the Tableau prompt. This way the group that is created gets automatically added to the shelf/card. You can also create groups by selecting a dimension and performing right-click and then create option. If the list of members is huge, like similar to our data set containing a huge list of addresses, the create group option also gives us a “Find” option using which we can do a search on the dimension members. For e.g. if we want to create a group for addresses with the name “N WESTERN” in it, then just search using this string and the members get highlighted from the entire list. Another interesting use case for groups is to use it for data standardization. We may have encountered data sets which contain the same data member spelt in various ways, such as “Santa Clara University”, “SCU”, “Santa Clara Univ.”, etc. This kind of data set will create problems when we want to aggregate measures for Santa Clara University. This problem can be solved by grouping the above mentioned items into a single group since they represent a single entity.

We will take a look at actions in the upcoming blog!

References:

The art of truthful rhetoric in visualization

Rhetoric is the art of effective and persuasive communication. Data is rhetorical by definition and can be used for truth finding as well as truth hiding, hence it it is a double edged sword. To ensure we develop a sound argument from data, here are few tips:

Context and Data Provenance:

There is hidden context in many visualizations, and this context helps give an accurate depiction of the data, even if the viewer is unaware that the context exists. One must ensure the visualization shows as much context as is reasonably possible. For example, if a survey had a sample size of only 10 participants, it is important to put that information on the chart for readers to gauge the magnitude of the impact of survey results and to evaluate our story.

Rhetoric in Truthful Storytelling with Data:

Let us consider the simple info-graphic that represents the results of a survey conducted by a company to review the worst performing areas of their website. There is clear indication of the source of the survey at the bottom, which includes the date of survey and number of participants. The color coding highlights the two weak areas. The most important piece of information here is what could have had a significant impact on the performance of the website – downtime in one of the data centers. Finally the conclusion is represented in the title of the visualization enabling the reader to quickly grasp the key take away from the visualization.

Representing uncertainties of data:

Most visualization techniques have been designed on the assumption that the data to be represented is free from uncertainty. Challenges with representing uncertainties:

  • Uncertainty tends to dominate certainty.
  • Uncertainty introduces a new direction to the story.
  • Uncertainty propagates quickly and could confuse the audience.

Though I have understood the challenges in identifying uncertainties, I am still exploring if one should always represent the uncertainties of data and how to best represent uncertainties without rendering the visualization less effective.

References:

https://faculty.washington.edu/jhullman/vis_rhetoric.pdf

www.daydreamingnumbers.com/blog/rhetoric-in-visualization/

http://www.scribblelive.com/blog/2012/06/07/context-in-data-visualization/

http://www.comp.leeds.ac.uk/kwb/publication_repository/2012/uncert.pdf

Eyeo Crowd Cloud

Since 2011, the Eyeo Festival is bringing together creative coders, data designers and creators at the intersection of data, art and technology for inspiring talks, workshops, labs and events. The idea behind the festival is inspired by the notion that we live in a decade of an exceptionally exciting time to be interested in art, interaction and information. Following on this principle, Eyeo has managed to gain a large number of followers over the past 5 years. Looking at its increasing popularity, Moritz Stefaner created an Eyeo Crowd Cloud for 2015.

He created a network map based on 852 twitter accounts of various registered speakers, workshop presenters, panelists and attendees from 2011-2015, related to the Eyeo Festival. Though network is a good way to show the followings for different speakers, it is difficult to different between a speaker, a presenter or an attendee by just looking at the visualization. Also, because of the large number of followers and following incorporated in one network, getting exact figures of data is not possible from this network. Though, Moritz has used different font sizes for account holders based on their number of followers, there is no solid claim reflected here. In my opinion, using graphs and trend lines to show the increasing popularity of the festival and the speakers over the years would have told a better story and would have been more informative.


Reference: http://eyeofestival.com/eyeo-crowd-cloud/

Changes Over Time

One of the most useful ways of using visualization is to show the change of data over time. There are a lot of great visualization techniques like the line graph, scatter plot, bar chart, and many more. While there are many ways to show it, choosing the right way is very hard. Below are a few of the visualization types that you can use to represent changes over time.

Line – The most common time series graph. It is best used when you have a lot or just a few of data points. Use this when you need to place multiple data series on one graph.

Scatter – Scatter plots are best used when you have a lot of data points. They are useful when the data is not nicely structured.

Bar – Bar charts are best used when dealing with time scales that are evenly spaced out and the data set is distinct.

Stacked Bar – Same as the bar chart, but for when there are multiple categories.

Stacked Area – Stacked Area charts are best used when there are a lot of data points and there is not enough room in the visualization for bar charts.

Reference:

http://flowingdata.com/2010/01/07/11-ways-to-visualize-changes-over-time-a-guide/

https://datavizchallenge.uchicago.edu/sites/datavizchallenge.uchicago.edu/files/styles/slideshow-larger/public/uploads/images/game-genres.jpg?itok=viChdbPU


Marketing Metrics and KPIs

Marketing Metrics and Key Performance Indicators (KPIs) are measurable values used by marketing teams to demonstrate the effectiveness of campaigns across all marketing channels. Social media is one of the many channels that marketing team widely use and keep track of. Here’s an example how to use KPIs to measure the performance on twitter.

The dashboard above first offer a glance of the total number of current followers and how far it is to the target number. Then it lists some key metrics in past 30 days and the trend of them (increased or decreased). The right side of the dashboard shows the trend of visits in past 30 days, which offers real-time monitor to marketing employees to see how things are going. Therefore, visualization is a powerful tool when you understand the business, pick the appropriate metrics and use the right way to present it.

Interaction plays a crucial role in Data Visualization

In last exercise, we introduced interactivity in our visualization by creating parameters, applying filters, creating sets, calculated fields etc. We had different approaches to make it interactive in what sense. I found this article and would like to share some useful ways in which interactions can be used.

  1. Highlighting and Details on demand: Making use of highlights helps user to focus on important part of the visualization. Instead of including all information at once you can allow audience to choose and get details of their interest.
  1. User-driven Content Selection: With interactive visualization you give user an ability to change the content and drill down to grab relative information. Such a configurable visualization becomes the template through which different structurally similar data sets are displayed, and additional controls allow the user to change what data gets displayed. When used in such a manner, an interactive visualization can make a much larger data set accessible than a comparable static graphic.
  1. Multiple Coordinated Visualization: When you use single graphical representation, it limits number of dimensions. For example, maps emphasize geographic location and timelines the flow of time. Those commonly used representations also often have well-known interactions such as pan and zoom for maps. By assembling multiple standard parts and coordinating them, you can show different aspects of the data set at the same time. Also using appropriate filters user can understand relationships among the data.
  1. User-driven Visual Mapping Changes: You can improve the interactivity by showing data in different ways. Allowing the user to reconfigure the mappings from data to visual form (visual mappings) for a fixed visualization type is an alternative that can help in maximizing the visualization size.
  1. Integrating User’s Viewpoint and Opinions: In interactive visualizations, you can allow users to enter their opinions and improve their satisfaction with the visual.

Please visit the following website and get better understanding with the given examples.

Source: http://www.scribblelive.com/blog/2012/08/06/interaction-design-for-data-visualizations/

Linear Quantitative Scales: Issues and General Principles

To study importance of “right scale” let’s see the following graph which is from popular currency exchange website.


Source: www.xe.com

Now suppose you want to know the actual numeric value of right most point, we can see it is little less than half most point between 1.25 and 1.4  (i.e. little half of 1.4-1.25= 0.15), so about 0.6, now adding this to 1.25 it becomes 1.31.

The point I want to convey here is with wrong scaling techniques, it requires more of a mental work than one should actually perform to gain insights from the visualization.  One common source of this problem is algorithm used by common graph rendering software to create these scales. As a designer, one should be aware of this common problem and should consider the following points so that it is easy to perceive values from the graph.

1. All intervals should be equal: This means that the quantitative distance between 2 labels should be equal because if intervals are not equal, it becomes difficult to perceive the values in the graph.
2. Scale should be power of 10 or power of 10 multiplied by 2 or 5: Power of 10 include 10 itself, 10 multiplied by itself any number of times (10*10 or 10*10*10) or 10 divided by itself any number of time (10/10 = 1, 10/100 = 0.1 etc).
Also, it is important to note that 10 multiplied by 2 or 5 is not a constraint in cases where audience thinks of the measure as occurring in groups of any particular size. For example, months (3 or 12), RAM in Gigabytes (4 or 16) etc. A scale of month in form of (0, 5, 10, 15, 20..) is less cognitively fluent than the scale (0, 3, 6, 9, 12..)
3. Scale should be anchored to zero: This does not mean that scale should include zero, instead it means that if scale was to be extended to zero, it should have one of the labels as zero. For instance if we were supposed to extend the above graph the scales in decreasing order would be (0.80, 0.65……….0.20, 0.05, -0.10, -0.25) i.e. this scale has no place for ‘zero’ label hence it is an example of bad scaling.
4. Number of intervals: There is no general rule for this but the scale should provide as many intervals needed for the precision that audience requires but not so many that the scale gets cluttered.
5. Upper and lower bounds of the scale: The general rule is that the scale should extend as little as possible above the highest value and below the lowest value while still respecting the first 3 constraints defined above.
Exceptions to rule 5: a)When using bars, the scale must always include zero, even if it results to an extended scale. b)If zero is within 2 intervals in the data, the scale should include zero.

So next time, it is better to evaluate your scale on these five points before finalizing your graph.
Caution: Above rules apply to only linear quantitative scales.

References:
http://www.perceptualedge.com/blog/?p=2378
http://www.xe.com/currencycharts/?from=USD&to=CAD&view=1D

Data Visualization transforms Organic Valley

Organic Valley is one of the nation’s leading organic farm cooperatives, which not only provides milk to wholesale such as Wholefoods, Trader Joe’s, and Costco but also produces milk related product. It faces several challenges.

  • Where do them put the milk?
  • What do they do with the excesses of milk?
  • How fresh is it?

Organic Valley applies SAP Lumira data visualization software to get insight of their business performance and unveil hidden areas of opportunity. The profits visualization tool brings are:

Figure 2: One of the recently released features of SAP Lumira is the ability to combine multiple visualizations into a
Figure 2: One of the recently released features of SAP Lumira is the ability to combine multiple visualizations into a “story board.”
  • Milk comes out of cow at 4% butterfat and skimming yields skim (1% and 2% milk). Most of the profit is in whipping cream, half and half, and butter. Organic Valley got the idea how to better use of their raw elements.
  • Define most profitable customers, satisfy their need, and prevent their purchase products shortage. Visualization reveals hidden data and gives them a big picture, which shows various dimensions and highlights the group of customers they want to reach.

Visualization tools give Organic Valley a new way of thinking. First, visualization tools facilitate communication. Veterinary farm experts and dairy supply experts can give an effective showcase to the senior leadership and help them executives make data-driven decision. Moreover, Organic Valley also applied BI visualization in its IT department to examine and allocate its spending such as telecommunications and digital data communications overtime.

Reference:

http://searchsap.techtarget.com/feature/Organic-Valley-milks-insights-with-SAP-data-visualization-tool

http://searchsap.techtarget.com/feature/Give-SAP-Lumira-data-visualization-software-a-good-look-says-expert


Will the recent immigration rules under Trump administration impact the American economy?

Many Silicon valley companies opposed Trump’s immigration order immediately a week after it was implemented because the US innovation economy relies heavily on foreign talent. Also, it make it more difficult for US companies to continue with their day to day business operations and to recruit, hire and retain the world’s best employees.

Main Intention:-   So far since Trump was elected, four bills related to reforming the visa programs have been presented to the Congress. This has caused a huge concern among the Tech community since they feel these bills could be a stepping stone to a huge change in the entire legal immigration system. The four bills are:

Bills presented on visa program reforms

Understanding the viz :- The below visualization is first broken by Visa holders and Green card holders and further partitioned by the type of the worker visa. Let’s direct our attention to the worker visa section which has a total of 807,212 visas. Workers with these types of visas take a lower salary in comparison with American workers which thereby implies drop in American worker wages.

Main types of worker Visas and segmentation of green card holders

One of the above bills proposes to raise the salary cap for obtaining a H1-B visa to 100k per year. Another bill proposes to curb the replacement of American skilled workers with cheap H1-B or L-1 workers.

As we can clearly see from the below plot on green cards, only 14% is employment based whereas a huge 33% belongs to spouses or children of green card holders working in US. These green card holders could potentially compete for US citizen jobs.

Critiquing the visualization:-  

  • For the bigger box chart on Visas, a better representation could be to use percentage instead of total number of visa holders of each type.
  • Also, when the main focus is on employment visas it can be highlighted better with a different color that catches the attention of the audience (“Eye beats memory”).
  • The segmentation of the different types under employment visa again can be shown more clearly using a better tool tip.

KPI :–

  • Number of visa issued in 2015
  • Number of green card holders in 2015

Argument:-

Why does US need these foreign workers?

They are talented, skilled and top class competitive workers. Their expertise and labor is beneficial for the economy which raises the standard of living for Americans. This helps US compete more effectively on a global scale.

Reference: https://www.washingtonpost.com/graphics/national/visas-impact/