Rhetoric is the art of effective and persuasive communication. Data is rhetorical by definition and can be used for truth finding as well as truth hiding, hence it it is a double edged sword. To ensure we develop a sound argument from data, here are few tips:
Context and Data Provenance:
There is hidden context in many visualizations, and this context helps give an accurate depiction of the data, even if the viewer is unaware that the context exists. One must ensure the visualization shows as much context as is reasonably possible. For example, if a survey had a sample size of only 10 participants, it is important to put that information on the chart for readers to gauge the magnitude of the impact of survey results and to evaluate our story.
Rhetoric in Truthful Storytelling with Data:
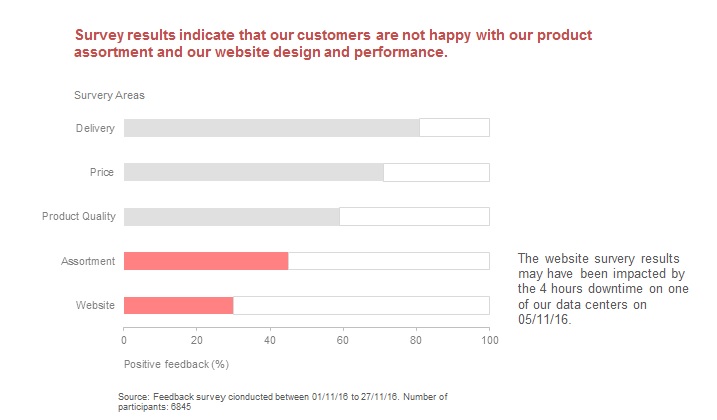
Let us consider the simple info-graphic that represents the results of a survey conducted by a company to review the worst performing areas of their website. There is clear indication of the source of the survey at the bottom, which includes the date of survey and number of participants. The color coding highlights the two weak areas. The most important piece of information here is what could have had a significant impact on the performance of the website – downtime in one of the data centers. Finally the conclusion is represented in the title of the visualization enabling the reader to quickly grasp the key take away from the visualization.
Representing uncertainties of data:
Most visualization techniques have been designed on the assumption that the data to be represented is free from uncertainty. Challenges with representing uncertainties:
- Uncertainty tends to dominate certainty.
- Uncertainty introduces a new direction to the story.
- Uncertainty propagates quickly and could confuse the audience.
Though I have understood the challenges in identifying uncertainties, I am still exploring if one should always represent the uncertainties of data and how to best represent uncertainties without rendering the visualization less effective.
References:
https://faculty.washington.edu/jhullman/vis_rhetoric.pdf
www.daydreamingnumbers.com/blog/rhetoric-in-visualization/
http://www.scribblelive.com/blog/2012/06/07/context-in-data-visualization/
http://www.comp.leeds.ac.uk/kwb/publication_repository/2012/uncert.pdf