Since 2011, the Eyeo Festival is bringing together creative coders, data designers and creators at the intersection of data, art and technology for inspiring talks, workshops, labs and events. The idea behind the festival is inspired by the notion that we live in a decade of an exceptionally exciting time to be interested in art, interaction and information. Following on this principle, Eyeo has managed to gain a large number of followers over the past 5 years. Looking at its increasing popularity, Moritz Stefaner created an Eyeo Crowd Cloud for 2015.
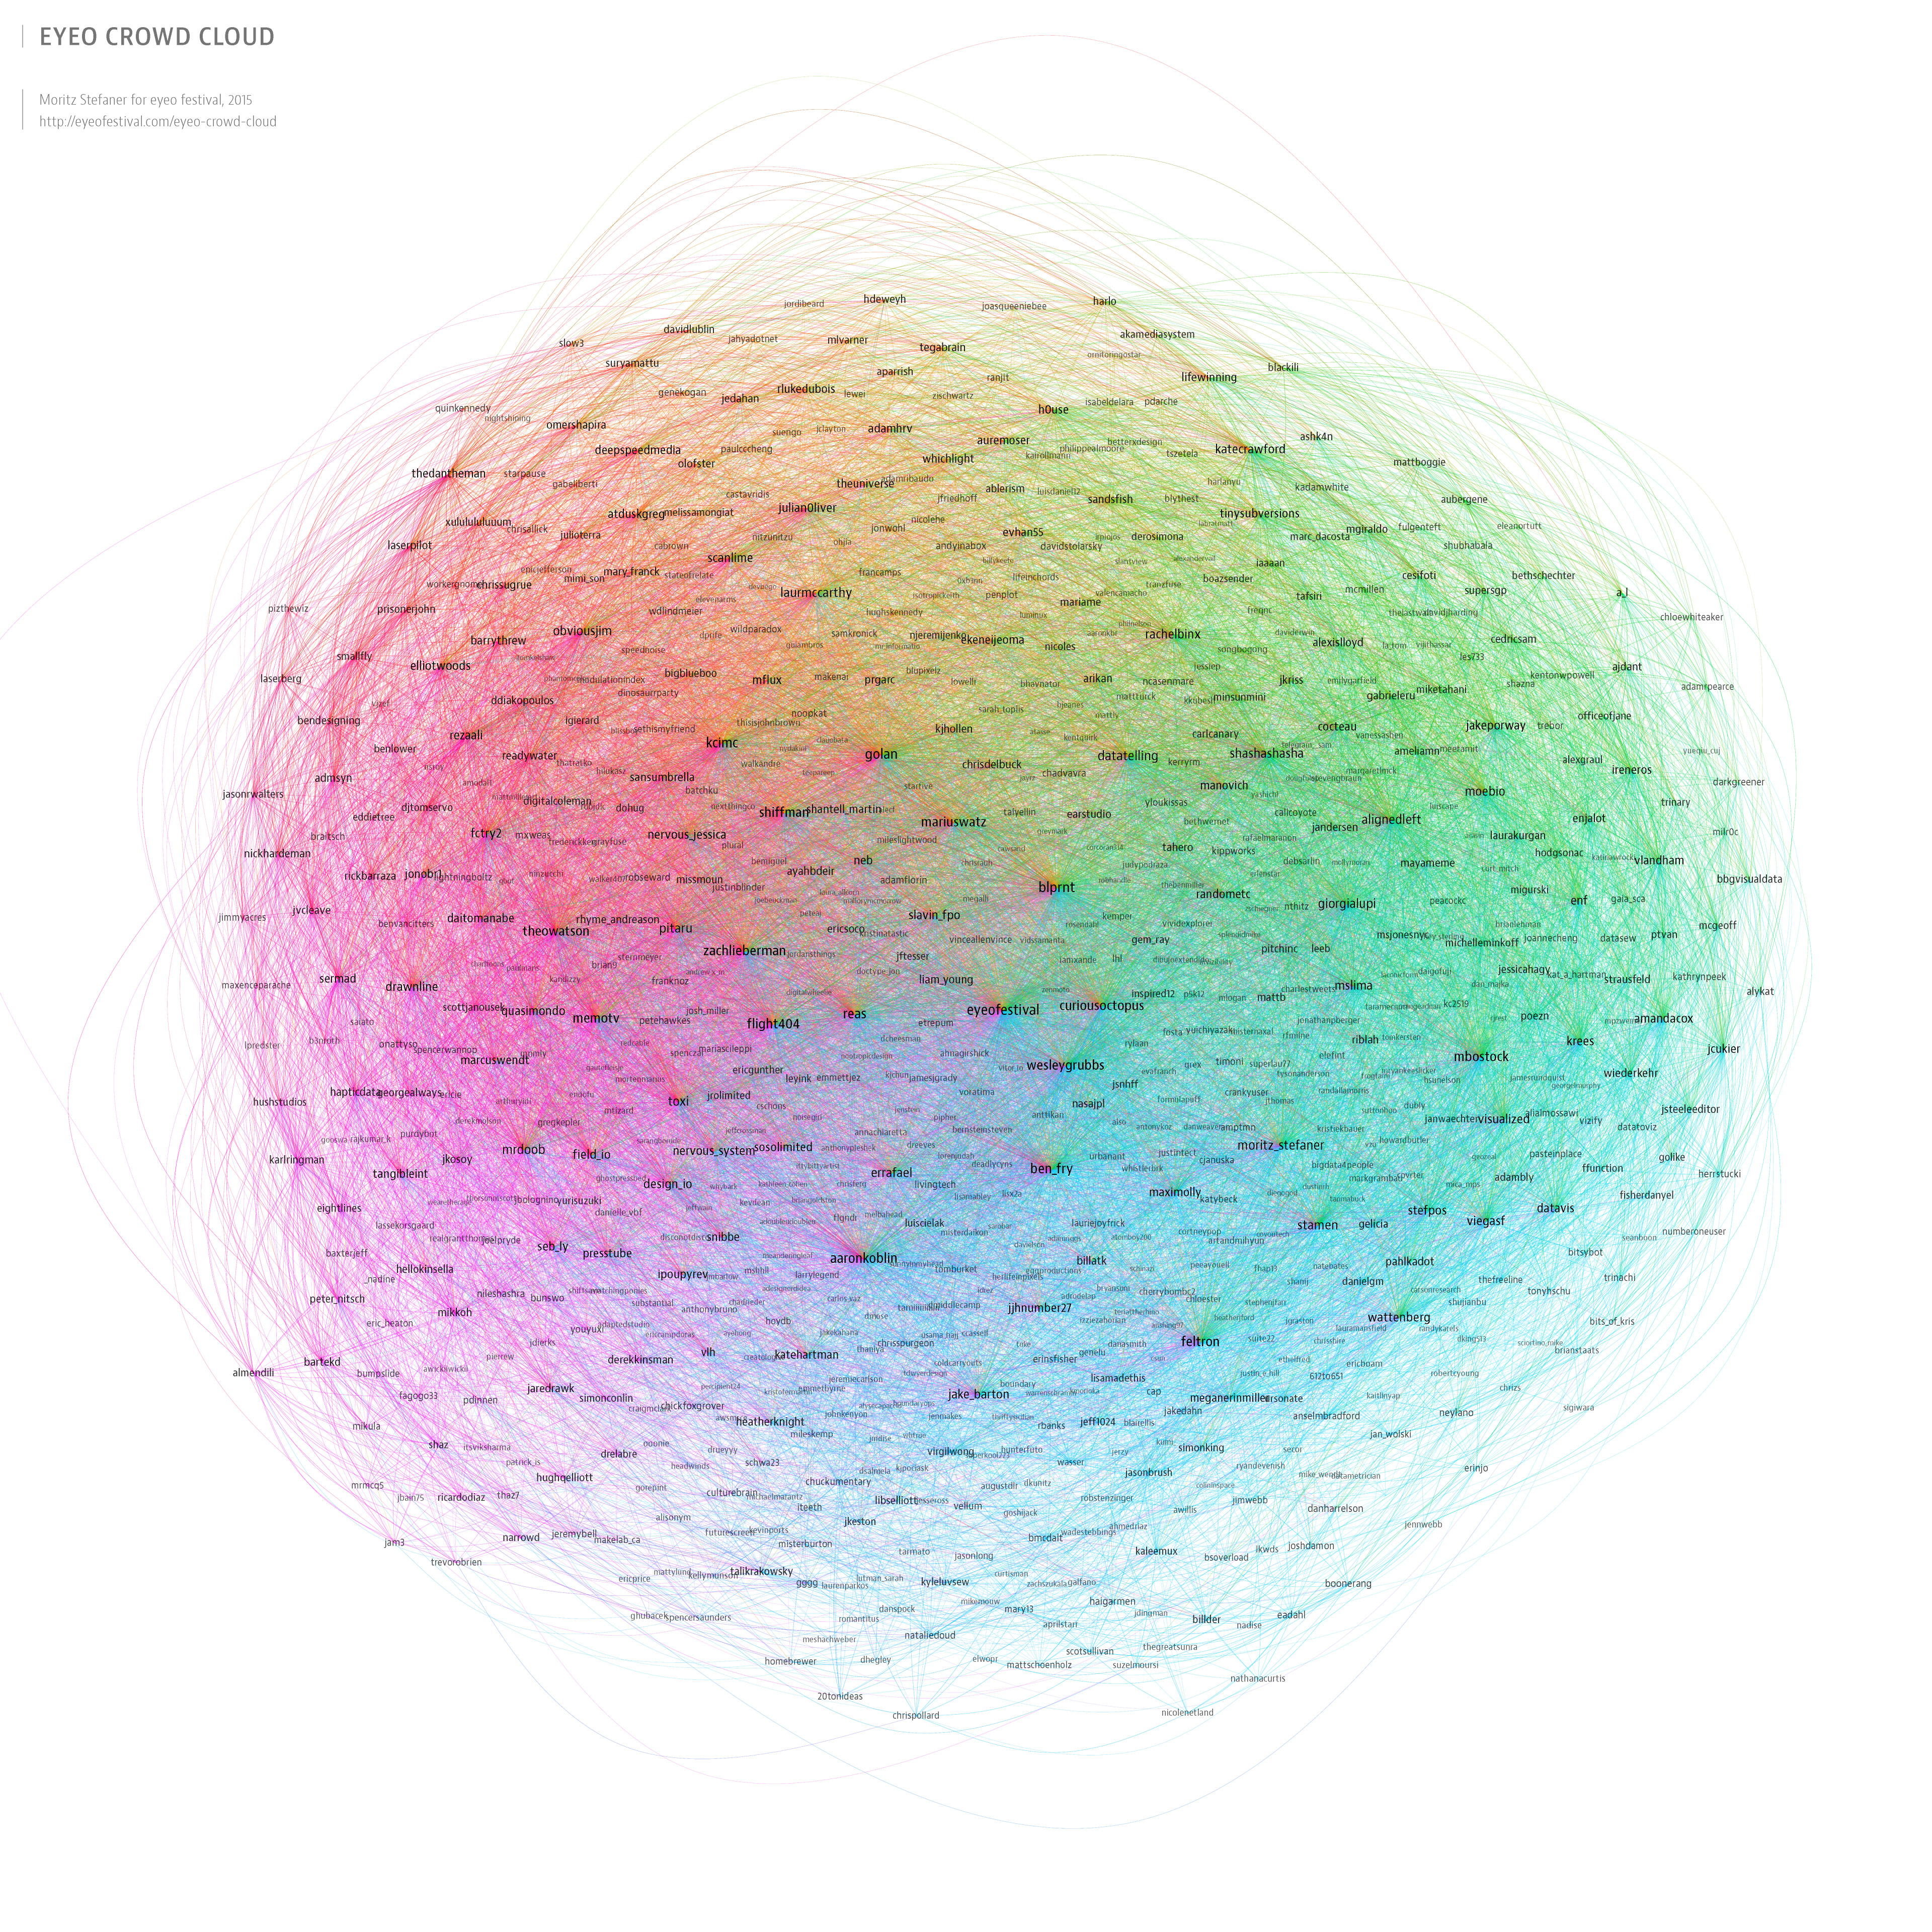
He created a network map based on 852 twitter accounts of various registered speakers, workshop presenters, panelists and attendees from 2011-2015, related to the Eyeo Festival. Though network is a good way to show the followings for different speakers, it is difficult to different between a speaker, a presenter or an attendee by just looking at the visualization. Also, because of the large number of followers and following incorporated in one network, getting exact figures of data is not possible from this network. Though, Moritz has used different font sizes for account holders based on their number of followers, there is no solid claim reflected here. In my opinion, using graphs and trend lines to show the increasing popularity of the festival and the speakers over the years would have told a better story and would have been more informative.
Reference: http://eyeofestival.com/eyeo-crowd-cloud/