This week I found an interesting dashboard. Lets step back for a second and try to understand what’s going on here.
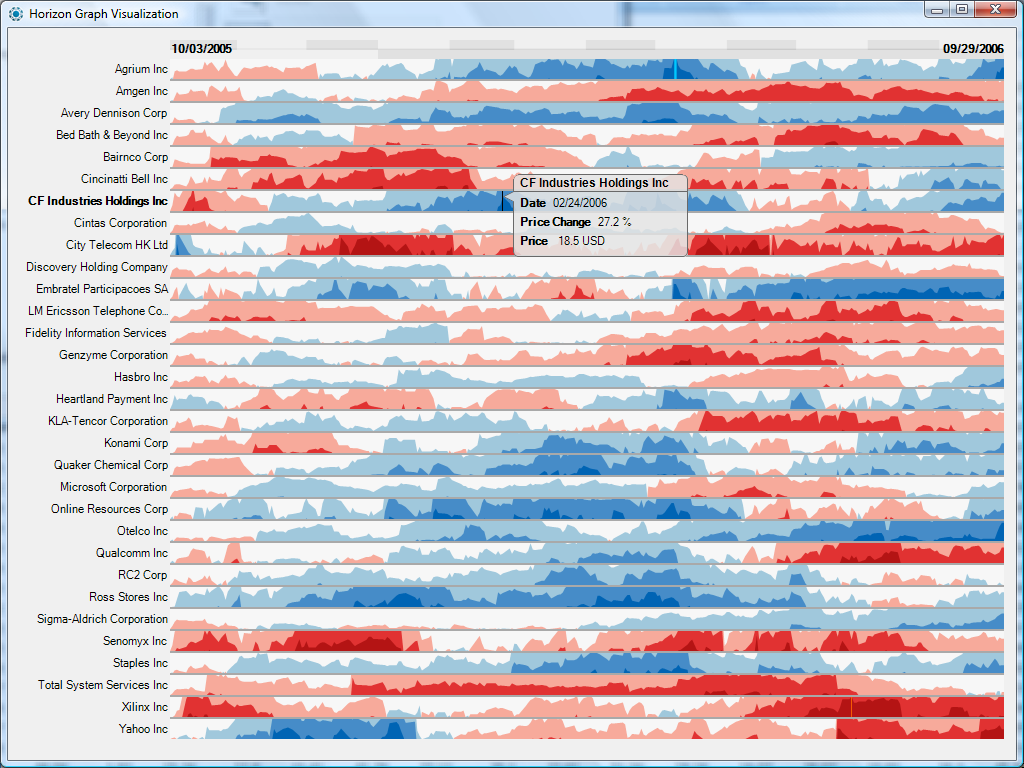
This is a Horizon graph. This is another way of representing time-series in a visualization. Created by a company called Panopticon, it allows users to display 50 or so sets of time series values that can be compared against each other. They are space efficient and quick to analyze once you get a hang of them (that’s what some people say)
Lets have a quick analysis –
- The visualization uses different shades of blue and red colors to show positive and negative values and different shades of these colors to show bands.
- By mirroring the chart, flipping negative values and using a different color the height of the chart is cut into half.
- Using bands also reduces the height leading to the ability to show more data on one graph.
- Easy comparison can be done between different multiple charts without scrolling, going to multiple pages etc. Remember, eye beats memory.
- It can successfully deal with increasing data densities by adding bands (2,3 or more)
For me, It is extremely overwhelming. For a person who has never worked with Horizon graphs before they seem challenging to understand and analyze. I feel there is too much information that is being visualized here which can lead to lost clarity and incorrect interpretations. There can be errors in estimating data and how does one ensure accuracy? I feel I will be going back and forth a lot just to confirm that I am reading the right values.
But as many people have said, Horizon Graphs take some time getting used to but once you know how to use them, they works well!
What are your thoughts?
Source-