Both Apple and Google are powerful and successful companies driving today’s cutting edge innovation and technology. The below visualization talks about the patents obtained in both these companies and how it translates into their organization structure.
Argument: Apple has a more centralized organization structure, originating from it’s well known design studio. Google, however has a stream of distributed open source approach to their new products.
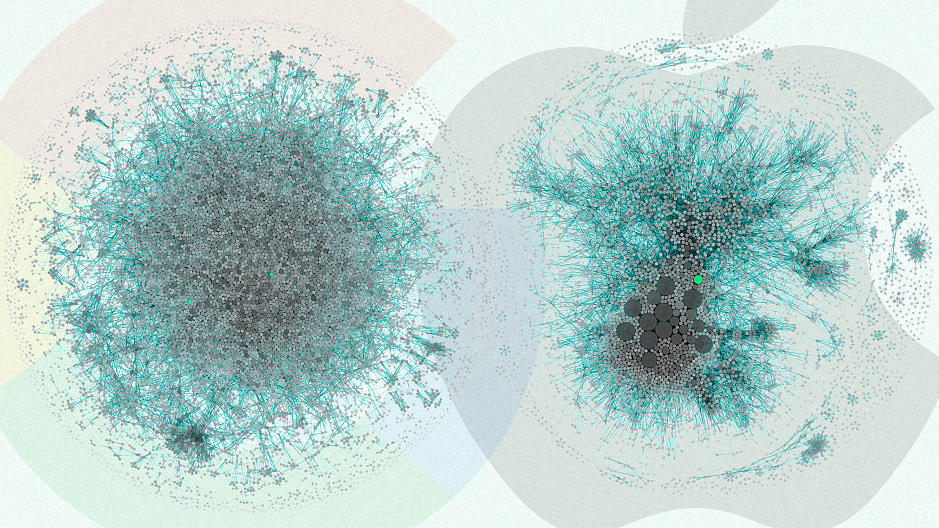
In order to prove this difference in organization structures, a data visualization company, Periscopic charted the last 10 years of patents filed at Apple and Google as a complex network of connections.
Understanding the visualization – Each blob is a patent inventor. As many patents can have multiple inventors , each line is a link between the inventor and the co-inventor. While Apple’s viz looks like multiple blobs scattered across, Googles’ viz looks more like a monotonous single blob which is evenly distributed.
According to the patent data, in the last 10 years:
- Apple has produced 10,975 patents with a team of 5,232 inventors.
- Google has produced 12,386 patents with a team of 8,888 inventors.
The proportion of patents seems to be similar, however, there is a group of highly connected experienced set of inventors at the core of Apple, however for Google its more evenly dispersed. This translates to a more top down, centrally controlled system in Apple. Google on the other hand has a more flat organization structure with many teams having experienced inventors.
KPI – Average number of inventors listed per patent.
- Apple – 4.2
- Google – 2.8
Because of even distribution of patents at Google one is bound to think that the average number of inventors listed on a patent should be more in Google than at Apple (from the above visualization). However, the underlying data denies this. On an average an inventor in Apple produced twice the patents than an inventor in Google.
Audience for the visualization – Periscopic helped develop a product called PatentsView which is a visualizer for American Institute for Research and US Patents Trademark Office.
About PatentsView – It transforms the patent database which is made public for over a century, into a viewable network of connections. The patents, can be viewed by company or can be sorted according to the creator or topic.
Main Intention – According to the CEO of Periscopic, they wanted to utilize the publicly available patent data to find interesting patterns and also inspire others to explore this data.
Reference: https://www.fastcodesign.com/3068474/the-real-difference-between-google-and-apple