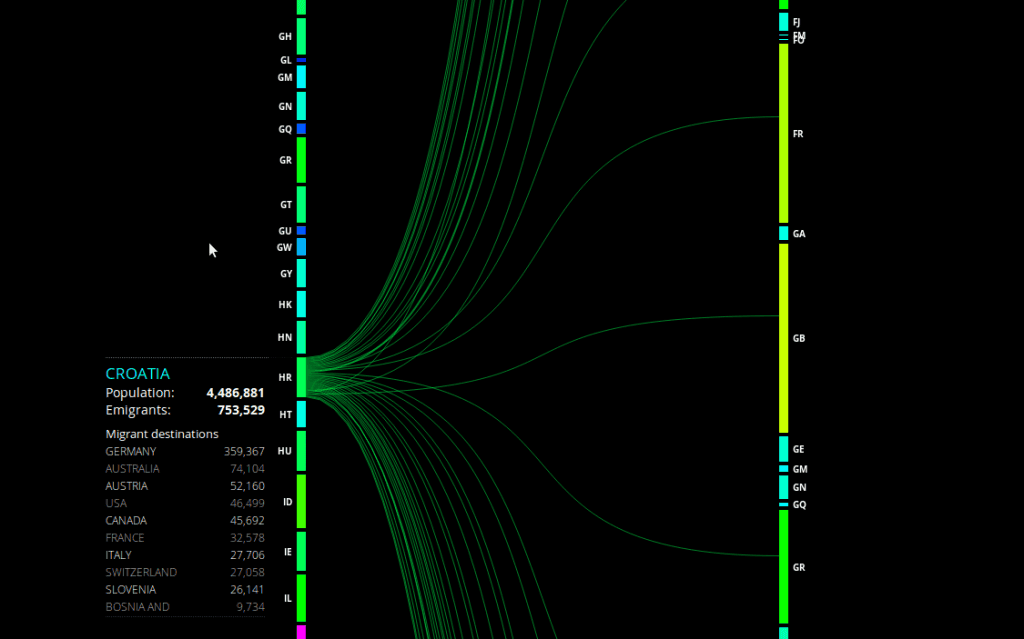
Peoplemovin is an experimental data visualization project which shows the immigration status of people from around the world. Created by Carlo Zapponi, this interactive visualisation shows flow of 215,738,321 migrants as of 2010. The data has been collected from the World Bank and plotted as flow charts representing the flow from emigrant country to the destination country. The blocks on the left represent emigrant country and the blocks on the right are the destination countries. Carlo has used attractive colour schemes with a different colour from blue to red to compare a particular country with the rest of the world. For example, the immigration details of India show that the largest number of Indians have migrated to the United States. The thickness of lines is used to represent the volume of immigrants. But it is difficult to get the exact figures by just looking at these lines. For this reason, the detailed figures for each country’s immigrants can be seen in a table on the left, based on the country selected by the user. Though, the visualisation is very attractive and informative, listing all the countries on the same page makes the columns on both sides very long, making it a little difficult to see the connecting flow lines. In my opinion, the visualization could have been simpler and more information.
Reference: https://datavisualization.ch/showcases/peoplemovin-visualizes-migration-flows/