To interact with your users, you want to transfer the control to them to discover more and make insights they find easier to retain. Here, I will share three different ways to leverage dashboard actions to improve your user experience.
Dashboard actions in Tableau allow you to add logic to dashboard components that create actions somewhere else. For example, you can add logic that says, “If a user clicks on Dashboard Sheet 1, I want something to happen on Dashboard Sheet 2.” To set up a dashboard action, navigate to “Dashboard > Actions> Add Action” in the top navigation from any dashboard view. Three types of action will be presented: Filters, Highlight, and URL. This week, I will introduce the filters first.
- Filter – If you click on sheet one, sheet two will be filtered to whatever you clicked on sheet one. Example: Here is an overview of the dashboard.
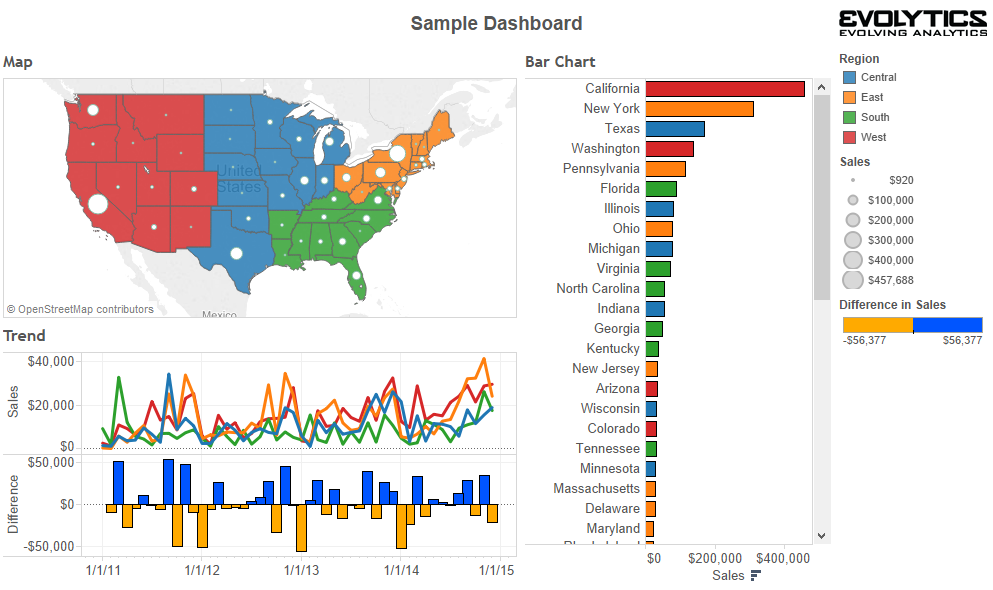
We could make every individual dashboard sheet as a filter for the entire dashboard by hovering over the sheet, clicking the down arrow that appears in the upper right, and selecting “Use as Filter” (on all three sheets).
Then when clicking on any sheet, the other sheets are filtered to whatever I clicked on. For example, if we click on Washington in my map view, the trend line and bar chart sheets will be filtered to just that state:

If not all of the sheets have enough data to show the details of each state, you should set the filters separately for each chart, for example only the bar chart instead of the map.
TO BE CONTINUED…
Reference: http://www.evolytics.com/blog/tableau-201-3-creative-ways-to-use-dashboard-actions/
Since we have to make an interactive dashboard this week, the blog post was helpful for getting a quick start!