Drought has always been a hot topic of discussion in United States. Drought in United States is similar to the other parts of the world. If the precipitation level goes below the normal precipitation, then it leads to the phenomenon known as drought. Droughts are usually more dangerous and destroying in nature than tornadoes, cyclones, winter storms and flood all together combined. Drought is more destructive in nature because its effects doesn’t show up immediately but shows up gradually over a long period of time.
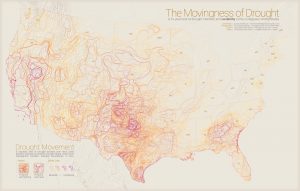
I am personally amazed by this visualization because it represents the effects of drought over a span of 5 years in a single static map. The map above has aggregated D1, D2, D3 and D4 . Following is the description of the effects caused by these drought levels
D1
- Damage to crops, pastures
- Request of restrictions for water use
D2
- Crop or pastures losses likely
- Water bodies start showing reduction in water levels
- Water restrictions imposed
D3
- Major crop losses
- Widespread water restrictions
D4
- Exceptional crop losses
- Drying of water bodies
- Water emergencies
Some places in USA are experiencing severe drought conditions and such visualizations can be really informative and useful to take serious actions to prevent drought
Reference: