The Rhythm of Food is an interactive data visualization website jointly created by Google News Lab and Truth & Beauty.
The project examines a wide range of edible items, from sushi to Chinese dumpling, showing their changes in popularity among different seasons from past 12 years (2004-2016). The data sources come from Google Search Trends, a data pool which records what interest people have in.
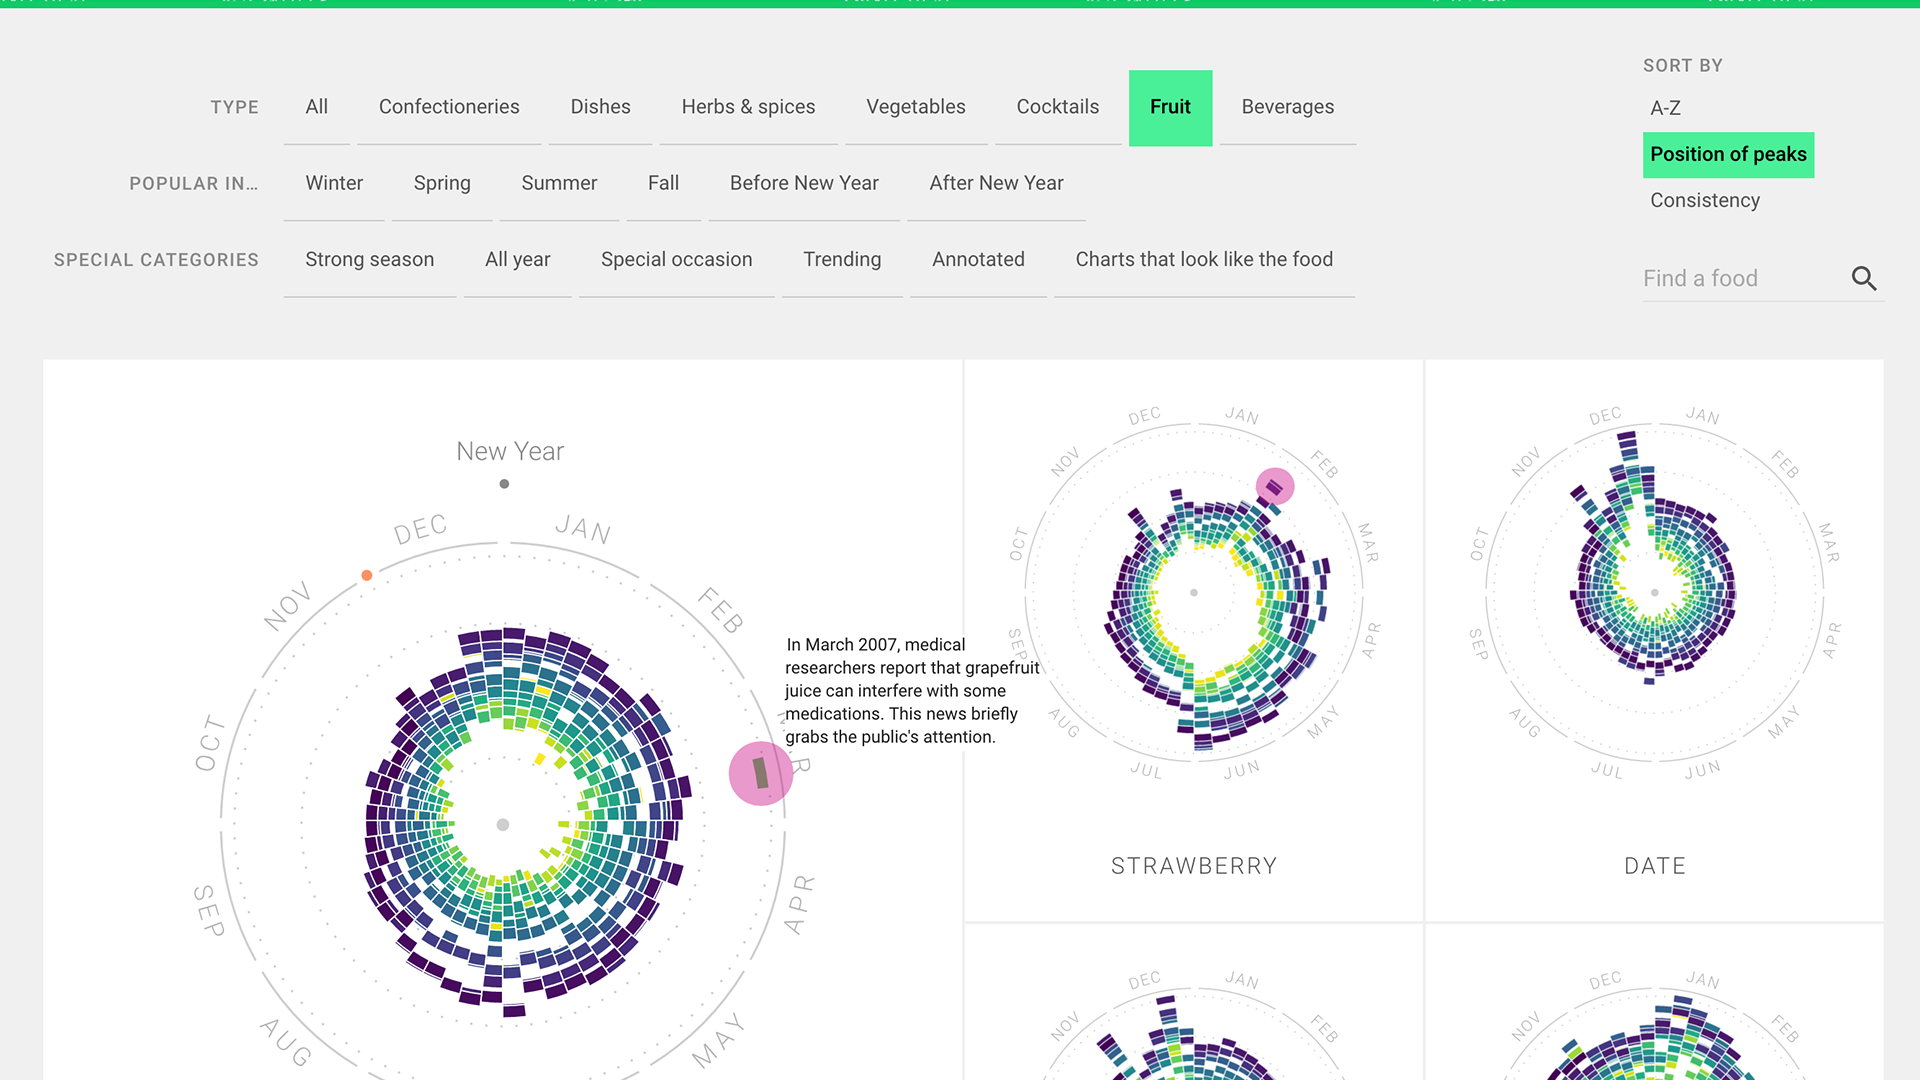
The two things I am very interest in were its data validation process and its interactivity. To keep the data be valid at first, the project uses Google Knowledge Graph topics to obtain the clean data. For example, the search record of “apple computers” will be distinguished as fruit “apple” and thus omitted by system. The data chart has high interactivity. User could search the trend of a food and apply three levels of filters to obtain a specific kind of result.
However, the data from google search engine might not reflect the real world. The system could present a more accurate data visualization by enrich its data sources in future.
Reference:
https://blogs.scientificamerican.com/sa-visual/visualizing-the-rhythm-of-food/