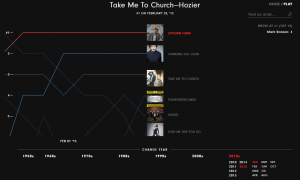
The Billboard Top 100 has become a standard in the music publishing industry for songs based on their record sales and their “air time”. A look at the referenced visualization shows the top 5 songs over a period of 58 years.
Though the visualization helped me take a trip down memory lane, I had few gripes with the presentation of it. First, the layout used for the entire visualization wastes a lot of real estate on the screen. More precisely, the filters for changing the year are placed at the bottom when they ideally could have been placed on the left side where the most visible filter (find an artist) is placed.
Secondly, the axis for the main visualization element is difficult to read as the horizontal axis (containing the month/year) is constantly moving and the vertical axis (containing the chart position) connects with the song across the timeline using a line graph which is difficult to read and grasp when the visualization is in “play mode”.
Furthermore, the threshold colors used are not intuitive since there are no legends to understand the gradient change i.e. from red to blue to light grey.
Reference: How Music Evolved: Billboard’s Hot 100, 1958 – 2016: http://polygraph.cool/history/