

Source: Wikimedia Commons
For my Critical Thinking and Writing class we wrote a 2000-2500 word research paper on a topic of our choice. I chose to research women athletic directors. Now we are transitioning to a new project . The main stipulation is that the project is multimodal. So it could be a video, an infographic, a screencast, or an image with text overlaid. Essentially the message in your paper, or a blogpost. We must carefully design our project to target our specific audience and convey our specific message.
I immediately started to research infographics. I knew that the research I had compiled on the shortage of women athletic directors would lend itself to graphs and statistics. Through infographics I hope to be able to bring light to the subject. It is rarely discussed in the media how few women are in leadership, so I feel that it is important to draw attention to it.
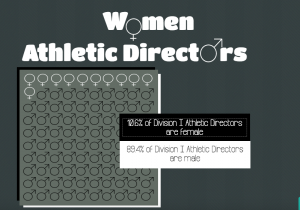
This is the first panel of my infographic. I have only just started so I will be adding at least a handful more panels. When I have finished the entire thing, I hope to post it as a blog and discuss the process of creating it. But, for now I just wanted to give you a sneak-peek of what is to come.
Sidenote: I highly recommend Piktochart ( the software the above graphic was created on). Not only is it free, but the interface is very user-friendly. You can easily just go on their website to play around, even when you don’t have a specific project in mind.